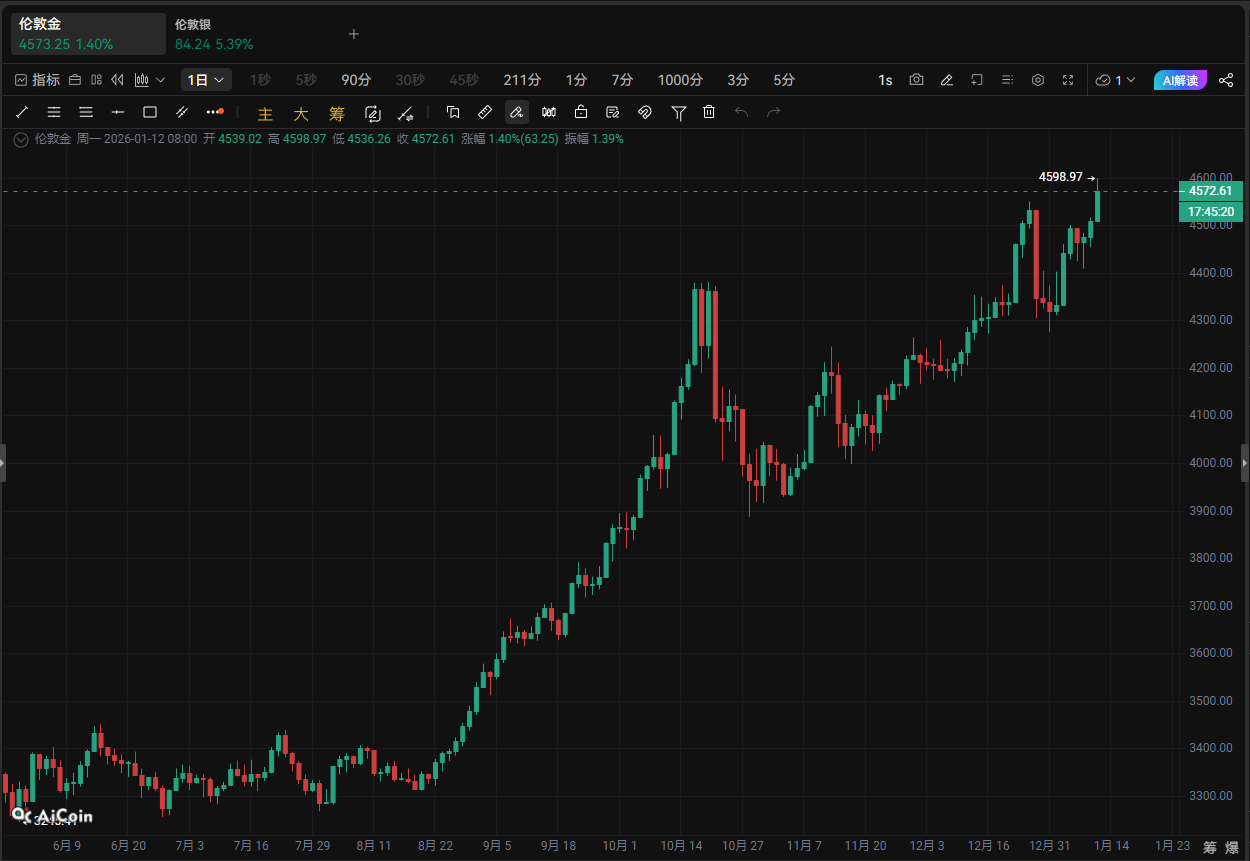
# I. Market Overview This Week
Last week, the cryptocurrency market showed signs of a gradual recovery, with market sentiment steadily rising from a state of deep caution, moving away from panic towards a more neutral and watchful atmosphere. Signs of capital testing the waters began to emerge, with selling pressure significantly weakening; however, the tug-of-war between bulls and bears has not yet concluded, and the market remains in a transitional phase of emotional recovery.
The expansion of exchange ecosystems and the movements of traditional institutions have become the core driving clues of the market. Coinbase, Bitget, and Binance are intensively advancing new token listings and locked mining activities, continuously injecting vitality into the market. The recommendation by U.S. banks to open cryptocurrency asset allocations marks a further acceptance of the crypto market by traditional financial institutions. Meanwhile, regulatory policy signals continue to be released, with various countries outlining risk boundaries through relevant statements and measures. Coupled with the short-term disturbances from the correlation between cryptocurrencies and stocks, as well as geopolitical factors, these elements together form the operational logic of the market last week.
# II. Core Market Trends and Capital Dynamics
The current cryptocurrency market is in a transitional phase of emotional recovery, exhibiting a pattern of oscillation and a tug-of-war between bulls and bears. From the perspective of market sentiment indicators, the Crypto Fear and Greed Index has risen from 31 last week to 43 today, both moving away from the deep fear zone. Market sentiment has shifted from cautious panic to a more neutral and watchful stance, with clear signs of capital testing the waters and significantly reduced selling pressure; however, it has not yet entered the optimistic zone, and the battle between bulls and bears continues.
In terms of market capitalization, the total cryptocurrency market cap today stands at $3.12 trillion, recording a 2.8% pullback within 24 hours. Looking back at recent trends, the total market cap quickly rebounded from about $2.9 trillion after New Year's, with a cumulative increase of approximately $250 billion over the week, peaking at $3.18 trillion. This pullback essentially represents profit-taking during the rebound process and has not reversed the overall trend of oscillation and recovery, with $3.1 trillion becoming a key short-term support level.
The performance of core cryptocurrencies further confirms the market's oscillation characteristics. Bitcoin's current price has dropped by 1.70% compared to the previous day, with a cumulative decline of 3.49% over the past week. Its market cap is reported at $1.82 trillion, with a slight decrease in market share to 58.26%, down 0.28 percentage points from the previous day. The short-term trend shows adjustment pressure, but the medium to long-term bullish trend remains unchanged. If it can break through the short-term resistance, it is expected to attract buying pressure to push it upward; if it tests key support, there may be opportunities for low-position layouts, requiring continuous attention to the changes in the tug-of-war between bulls and bears. Ethereum's adjustment trend is more pronounced, with the current price at $3,156.14, a 24-hour decline of 3.27%, and a cumulative drop of 9.84% over the past week. Its market cap is $383 billion, with a slight increase in market share of 0.02 percentage points to 12.23%. The short-term is already in an oversold state, with prices close to support levels, presenting opportunities for a technical rebound. However, caution is still needed for risks of pullbacks during the upward process. Low-buy opportunities can be seized based on support levels, and position strategies should be dynamically adjusted according to breakout directions.
The pressure on the capital side has significantly suppressed cryptocurrency prices, with both BTC and ETH ETFs showing continuous net outflows. Specifically, Bitcoin ETF saw a net outflow of $54.6 million today, with a cumulative net outflow of $349.35 million last week; Ethereum ETF had a net outflow of $76.2 million today, with a cumulative net outflow of $72 million last week. This data reflects that both institutional and retail investors are taking profits simultaneously, leading to a weakening of short-term market confidence. Attention should be paid to the potential for further pullbacks caused by continued capital outflows, while closely monitoring signals of capital inflow to assess market sentiment turning points.
The performance of the derivatives market highlights the current market divergence and a cooling of speculative enthusiasm. The open interest in futures contracts has increased to $3.22 billion, a rise of 17.58%, indicating that some capital is using futures tools to position themselves in the market, with increasing divergence in market predictions for future trends. In contrast, the open interest in perpetual contracts has significantly decreased by 19.89% to $67.293 billion, indicating that leveraged funds are actively exiting to reduce risk, leading to a cooling of short-term market speculation and potentially slowing volatility.
In summary, while the current market sentiment is steadily warming, there are still pressures from the capital side and core cryptocurrency trends. The market is overall in a phase of oscillation and recovery between bulls and bears. Future attention should focus on the effectiveness of the $3.1 trillion market cap support level, as well as key signals such as ETF capital inflow and core cryptocurrency breakout.
# III. Selected Trading Strategies
- High Yield Strategy Selection
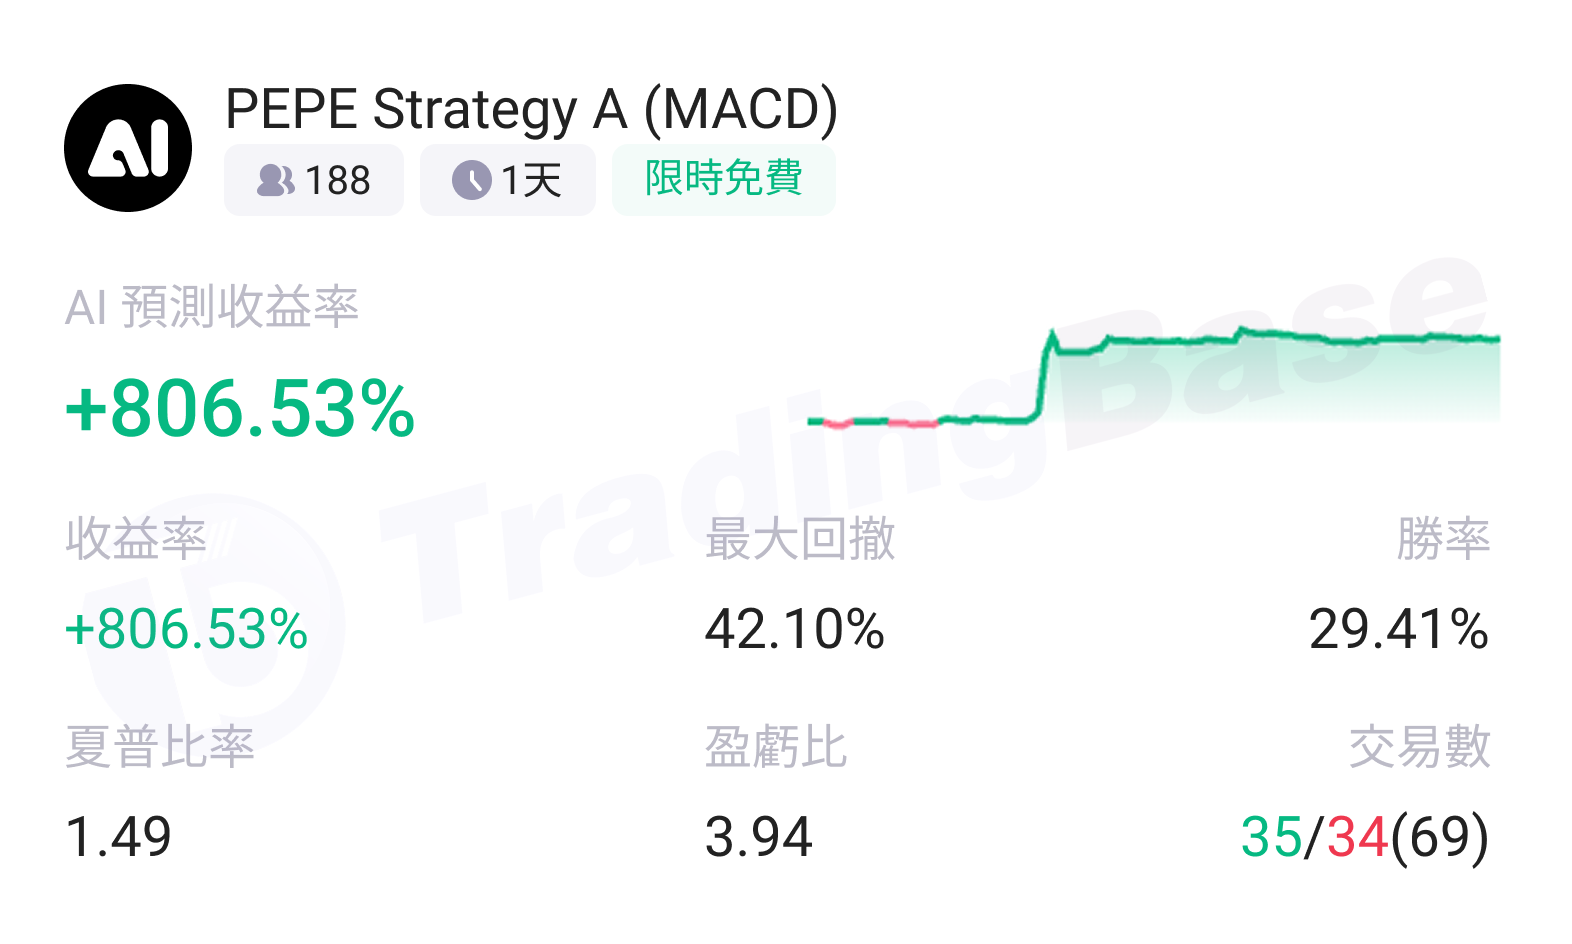
Core Highlights:
Outstanding Yield: An extraordinary yield of +817.98%, far exceeding the performance of mainstream cryptocurrencies, with a highly aggressive strategy.
Excellent Profit-Loss Ratio: A profit-loss ratio of 3.94 indicates that the profit potential of winning trades far exceeds the losses of losing trades, demonstrating high risk control efficiency.
Reasonable Sharpe Ratio: A Sharpe ratio of 1.49 (>1) indicates that the return on investment per unit of risk is attractive.
Applicable Scenarios:
Suitable for highly risk-tolerant, speculative investors seeking high elastic returns, only applicable during high volatility phases of small cryptocurrencies (such as during euphoric bull markets), requiring a fast-paced trading rhythm, not suitable for conservative or long-term investment funds.
- High-Frequency Trading Strategy Selection
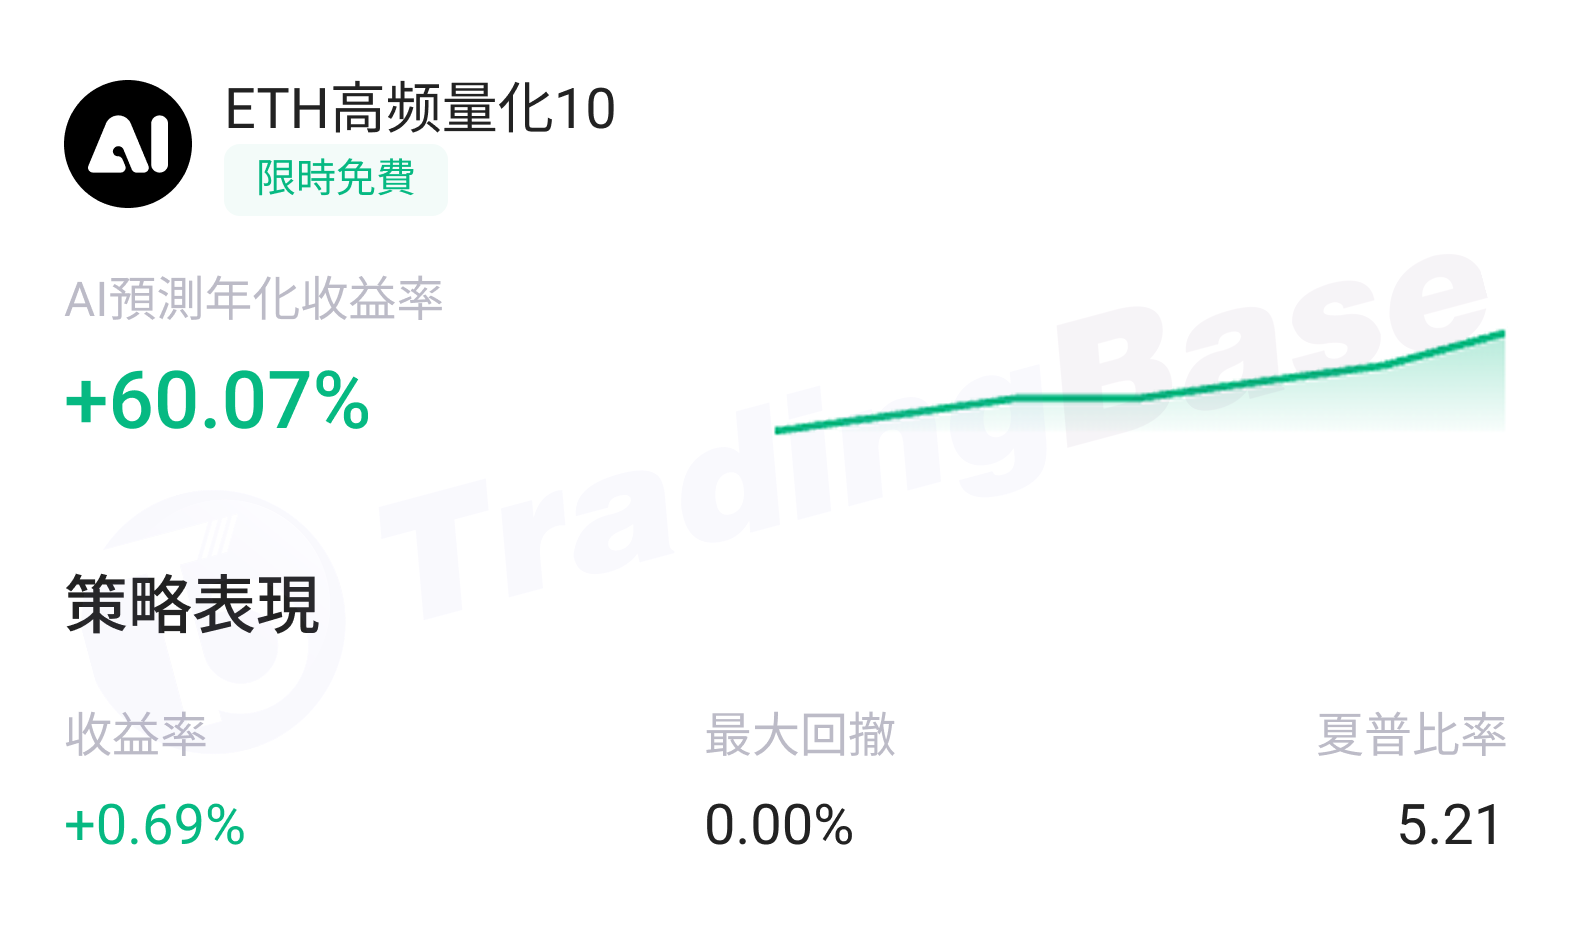
Core Highlights:
Maximized Short-Cycle Risk Control: A maximum drawdown of 0% in high-frequency trading indicates strong control over short-term volatility.
Superb Sharpe Ratio: A high Sharpe ratio of 5.21 reflects an efficient match of "low volatility + stable returns" in high-frequency trading.
Annualized Returns Adapted to High-Frequency Attributes: A predicted annualized return of 52.56% is considered stable and attractive within high-frequency strategies.
Applicable Scenarios:
Suitable for Ethereum's hourly oscillation or narrow fluctuation markets, ideal for high-frequency traders seeking "low volatility + continuous small returns," and can serve as a "stable return tool" for short-term funds, especially suitable for risk-sensitive investors looking to increase the value of idle funds.
3. High Stability Strategy Selection
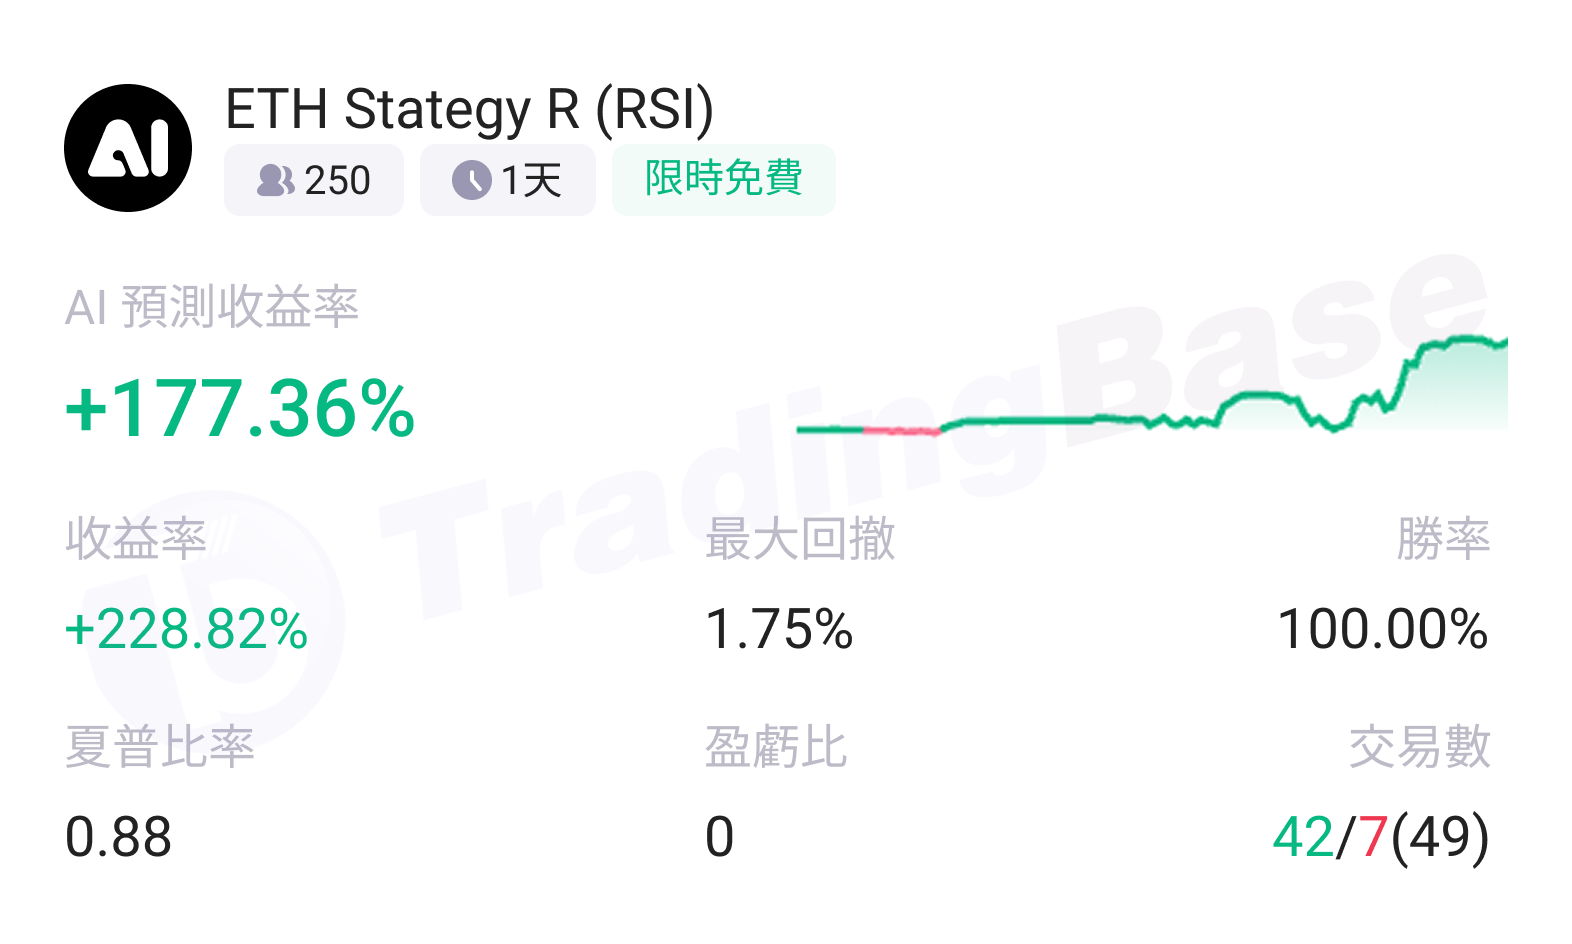
Core Highlights:
Extreme Imbalance of Returns and Drawdowns: A high return of 233.08% corresponds to a maximum drawdown of only 1.75%, indicating strong return elasticity and excellent volatility control.
Perfect Win Rate: A 100% win rate indicates extremely high accuracy of strategy signals, with almost no errors in trading decisions.
Applicable Scenarios:
Suitable for ETH trending markets (unidirectional rises and falls), ideal for conservative investors seeking "high returns + low volatility," and can serve as a return enhancement tool for medium to long-term ETH allocations, especially suitable for investors with moderate risk tolerance seeking excess returns.
Download TradingBase.AI to follow quality strategies with one click:
https://app.tradingbase.ai/downLoad
# IV. Top 24h Cryptocurrency Price Changes
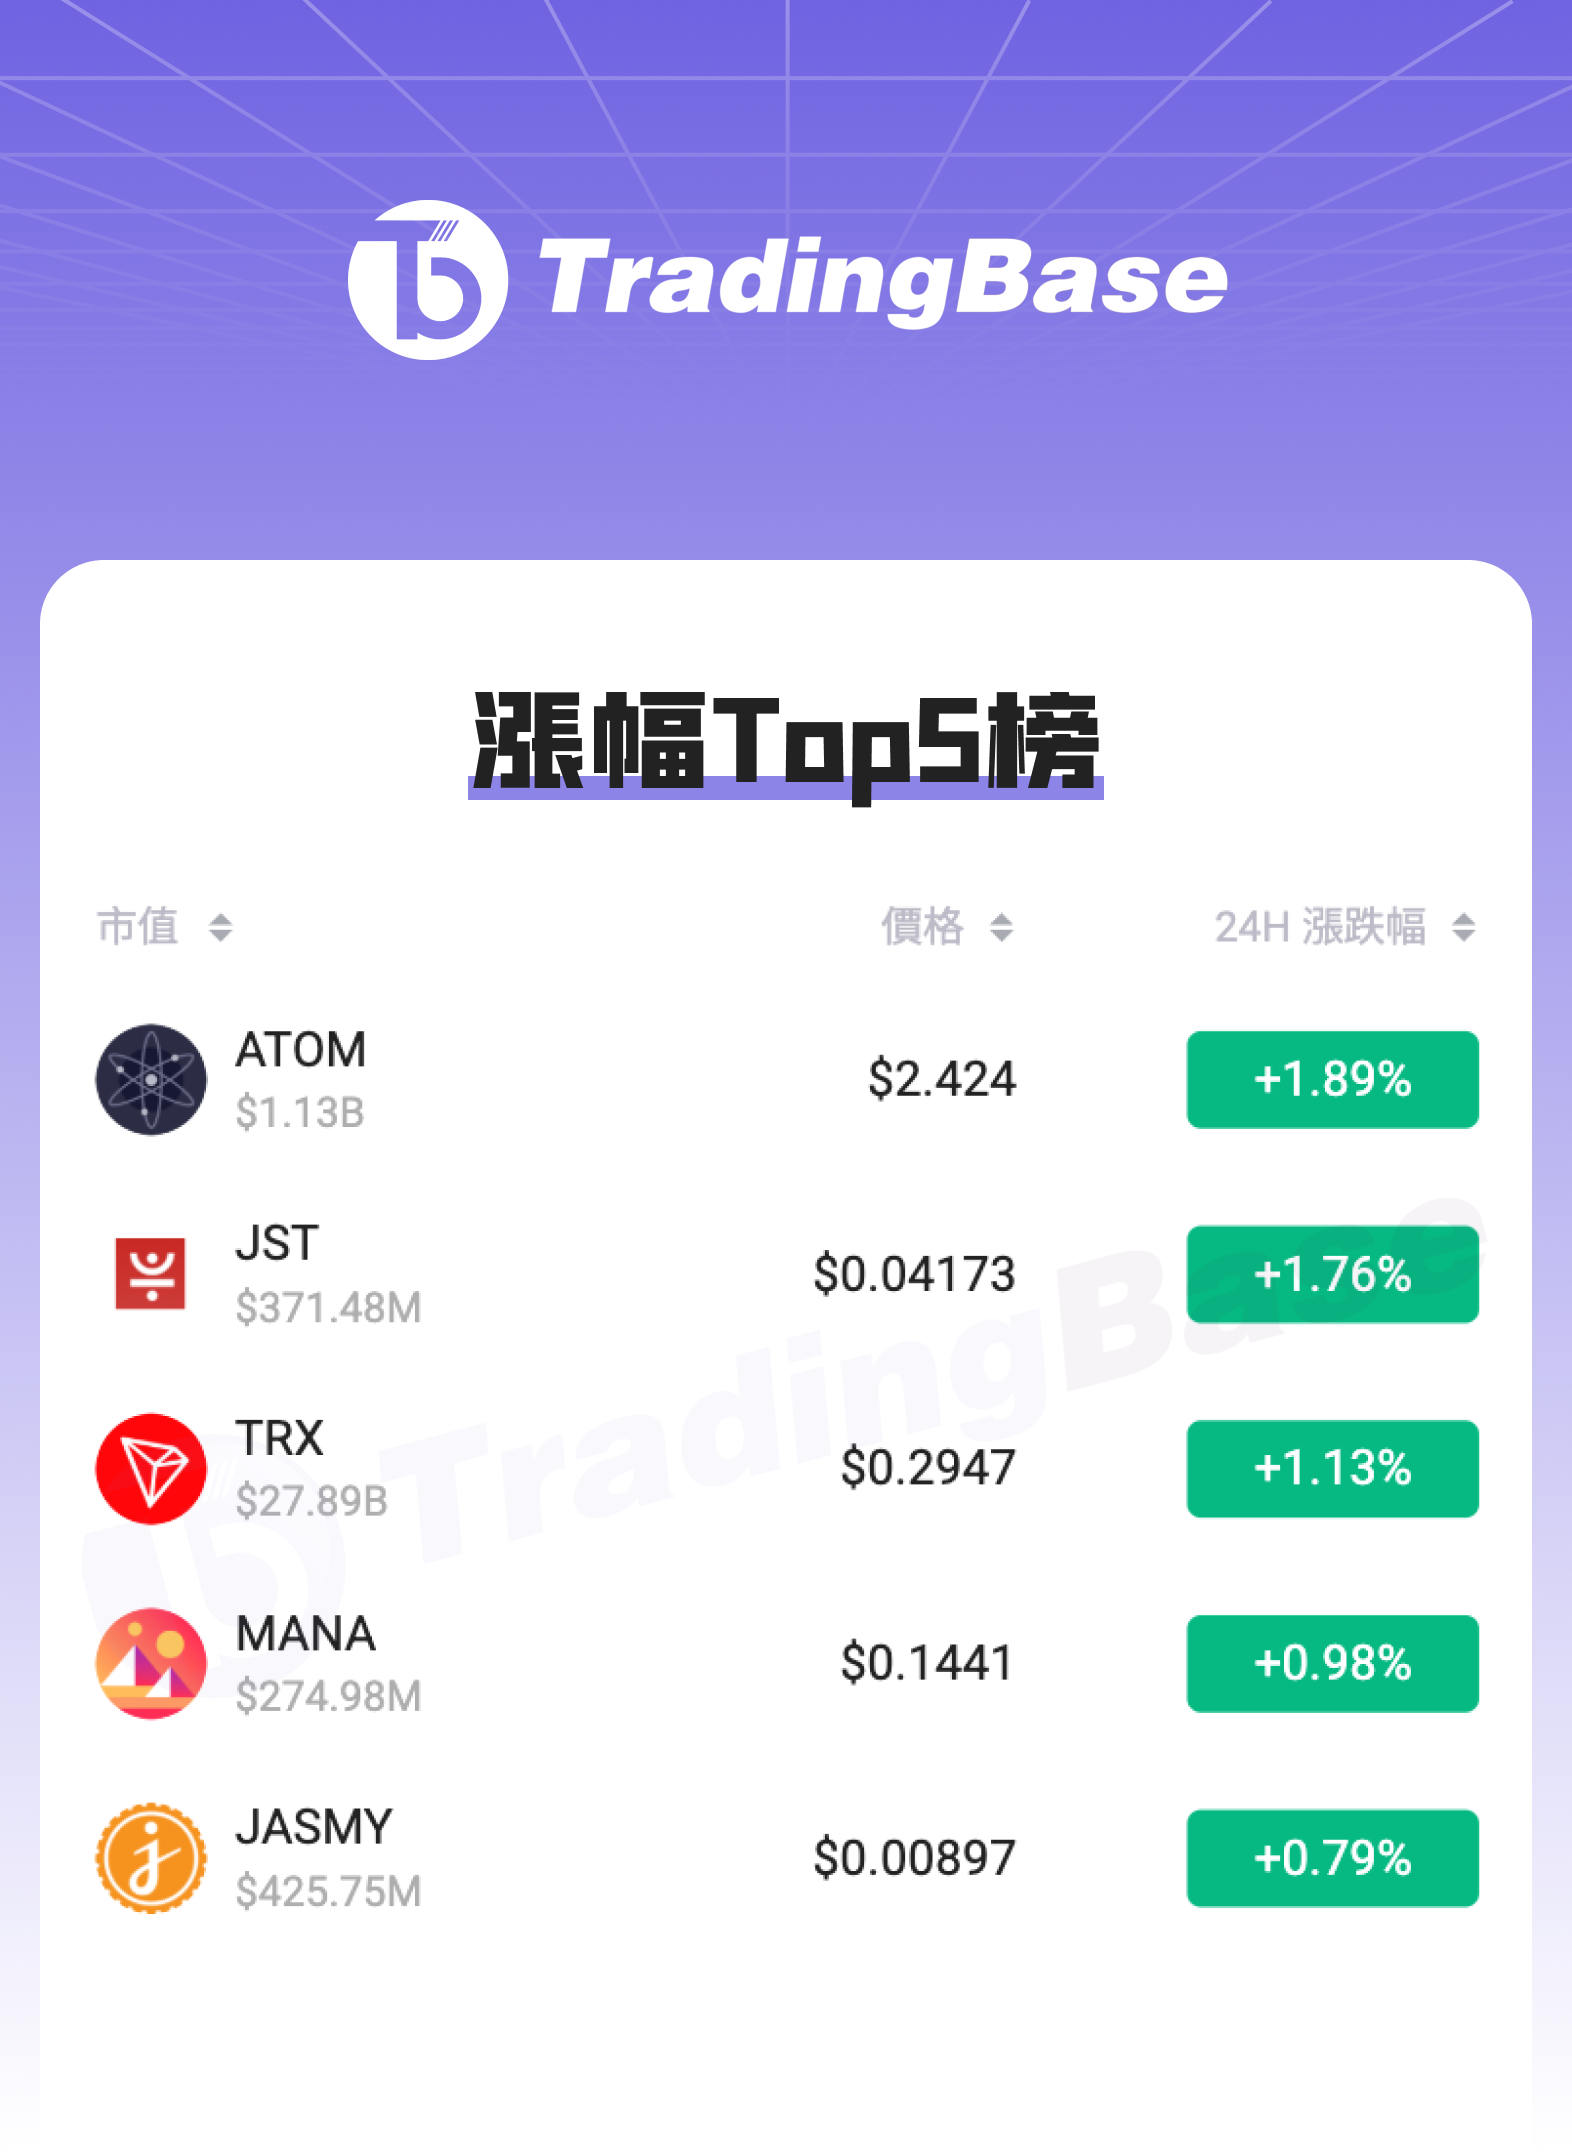
Top 5 Gains:
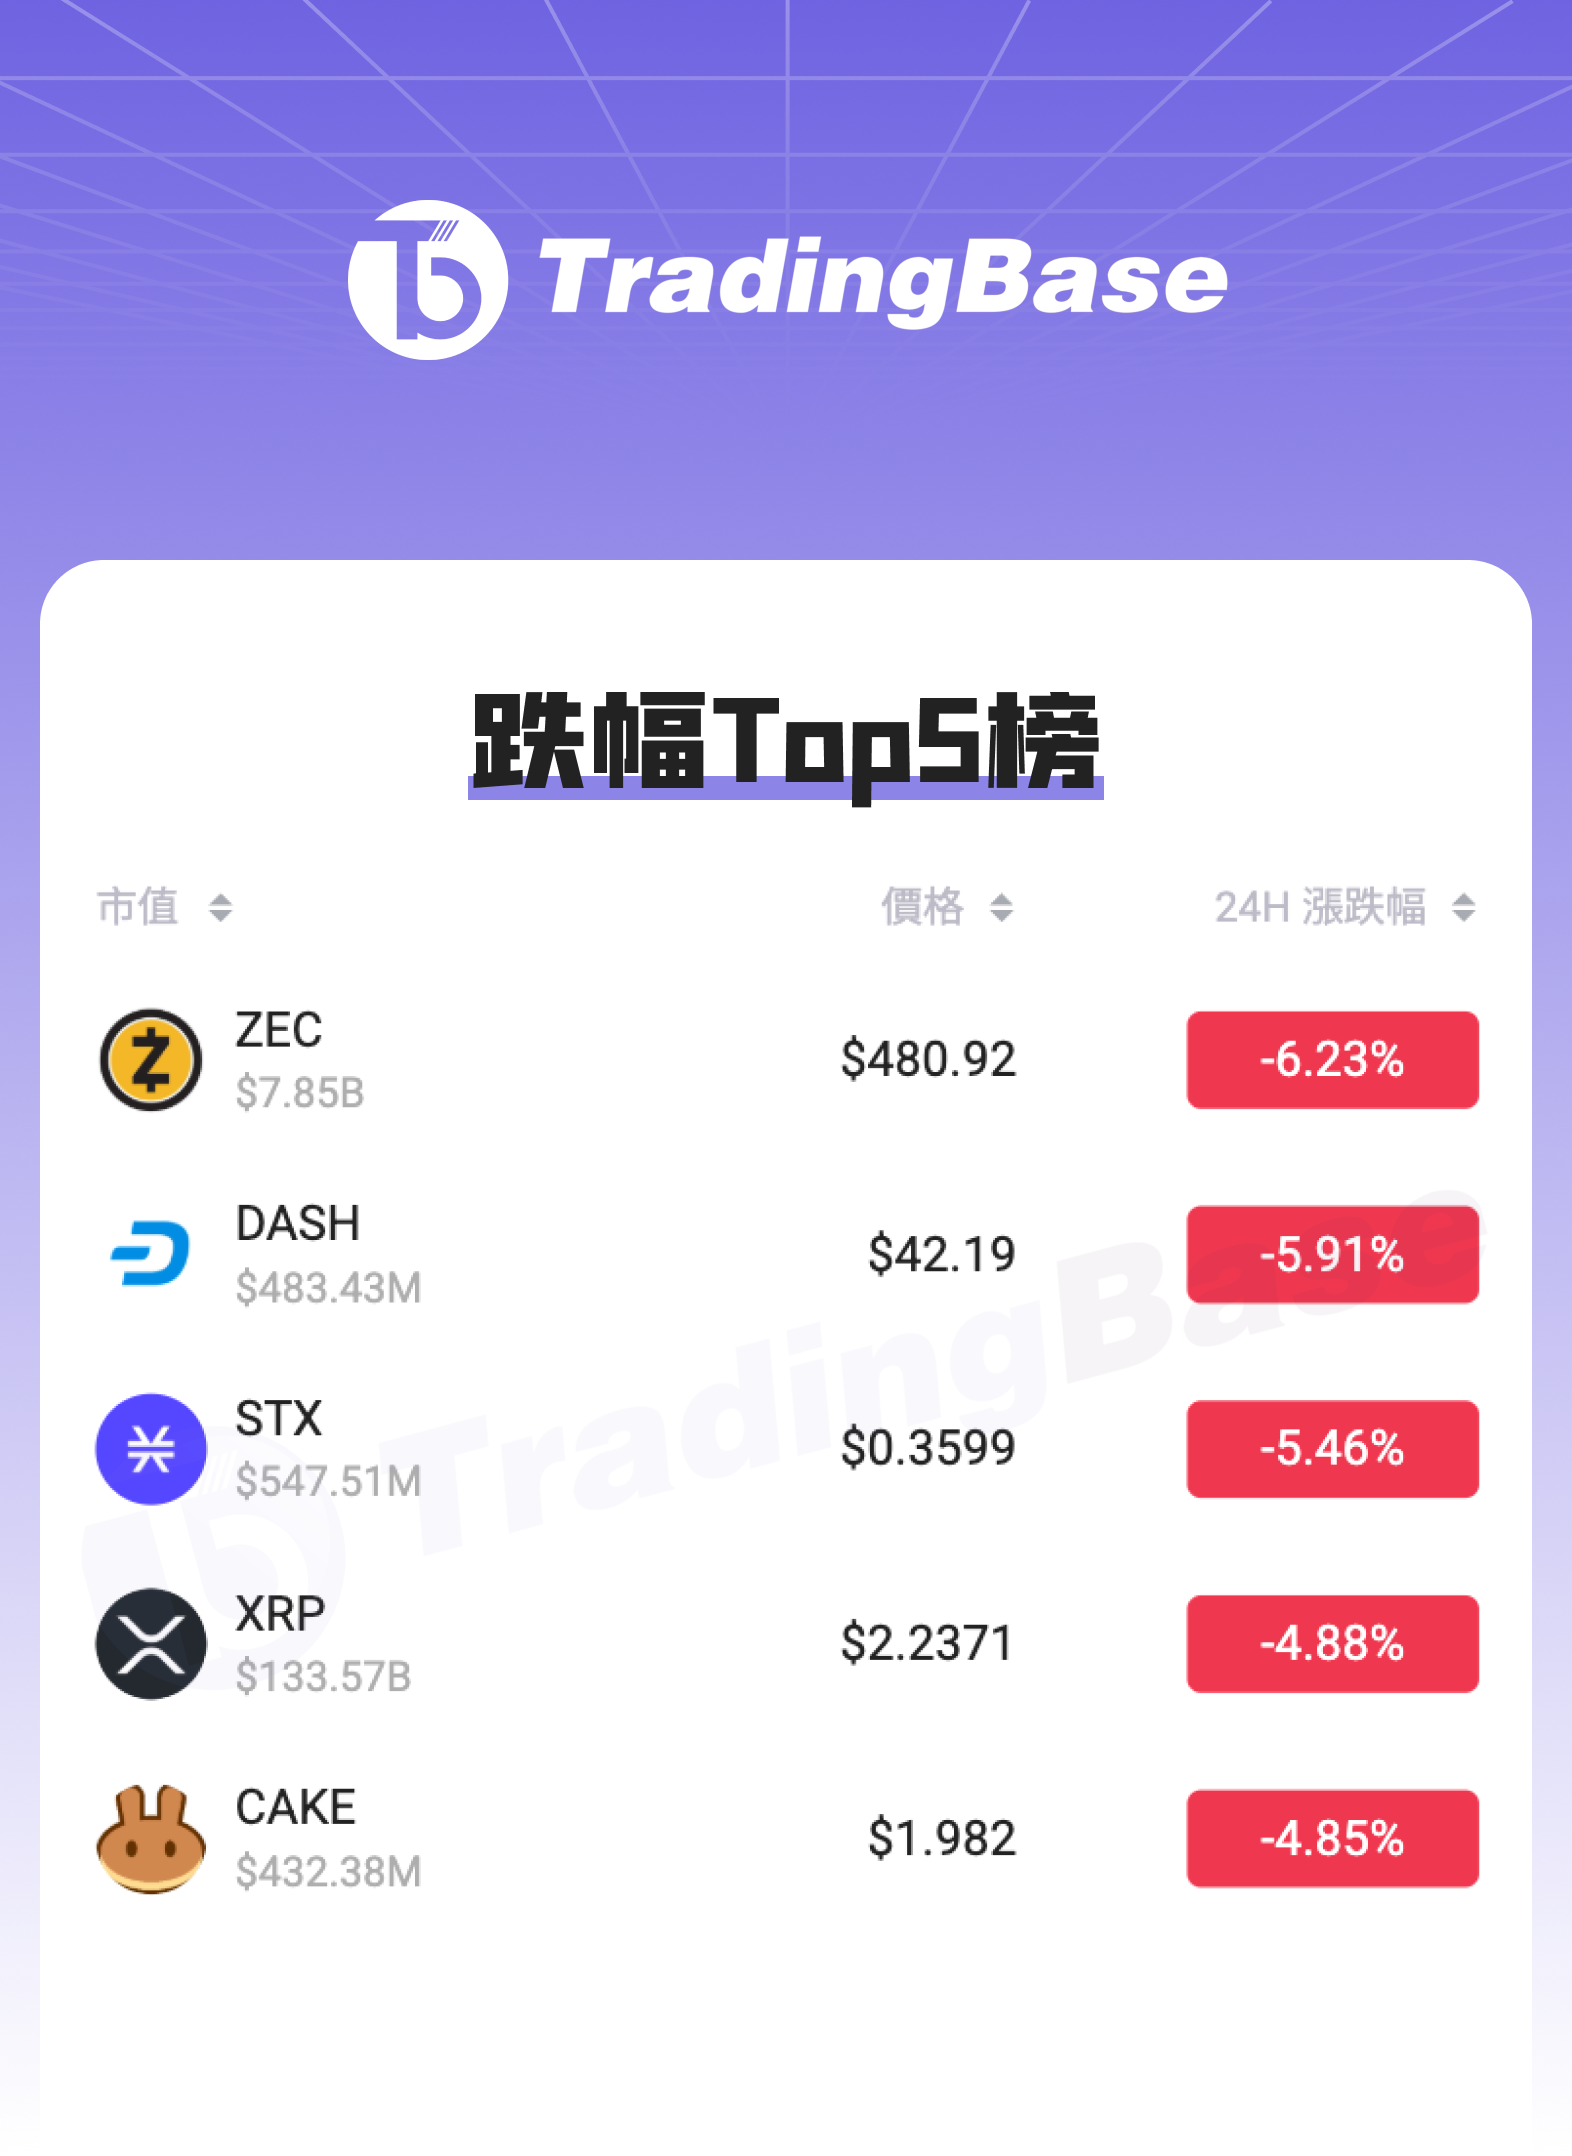
Top 5 Losses:
# V. Conclusion
This week, the market is primarily characterized by a recovering oscillation, with exchange actions, institutional layouts, and regulatory signals jointly dominating market rhythm. It remains in a phase of oscillation and recovery between bulls and bears. Future attention should focus on market cap support levels and signals of capital inflow. We welcome you to continue following this column for the latest market interpretations and strategy analyses.
免责声明:本文章仅代表作者个人观点,不代表本平台的立场和观点。本文章仅供信息分享,不构成对任何人的任何投资建议。用户与作者之间的任何争议,与本平台无关。如网页中刊载的文章或图片涉及侵权,请提供相关的权利证明和身份证明发送邮件到support@aicoin.com,本平台相关工作人员将会进行核查。