I. Recent Market Analysis Review
Let's first take an overall review of the recent analysis approach.
Before the price broke above 90,000, we maintained a bearish outlook.
It wasn't until the 3rd of this month that the price effectively broke above 90,000, leading to a change in our overall judgment.
The conclusion given at that time was:
The market has the conditions to continue rebounding upwards.
90,400 has already been surpassed.
The target looks towards a second test of the previous high.
Subsequently, the price moved as expected to around 94,000.
II. Why Expect a Pullback Near 94,000?
When the price reached 94,000, we anticipated a potential short-term pullback, primarily because:
This segment of the market is viewed as a two-phase upward structure.
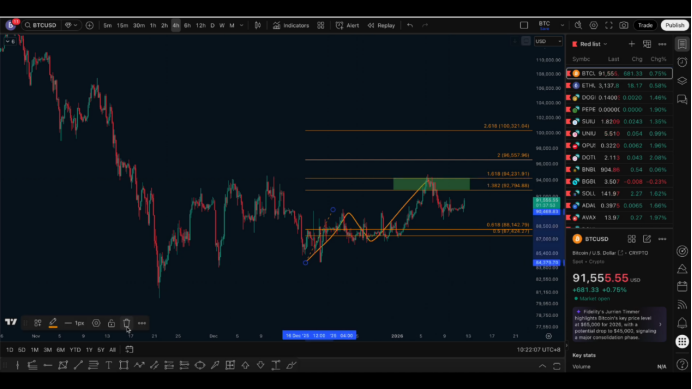
From a structural expansion perspective:
The selling pressure range corresponding to the first phase of the upward movement is between 92,800 – 94,300.
Therefore, the previous judgment was: bullish up to 94,000 (the area of the previous high).
After reaching that range, a pullback was expected.
III. Key Support Areas to Focus on During the Pullback
Regarding the pullback space, we emphasized the need to focus on:
The 0.5 – 0.618 range of the entire upward movement's pullback.
This is the core support area below, and this range has been tested multiple times in the past.
The corresponding price focus is:
Whether 90,000 will be broken.
The key reference point below is 88,400.
Ultimately, the price tested this support range.
IV. Is the Support Effective?
The market has provided an answer.
Last Thursday, Friday, and over the weekend, the price consistently operated above the support range, primarily in a consolidation phase.
From an hourly perspective, the price formed a potential multi-bottom structure.
This also validated an important conclusion:
There is indeed significant buyer demand below the integer level of 90,000, and the support below is effective.
V. Core Logic for Bullish Positioning
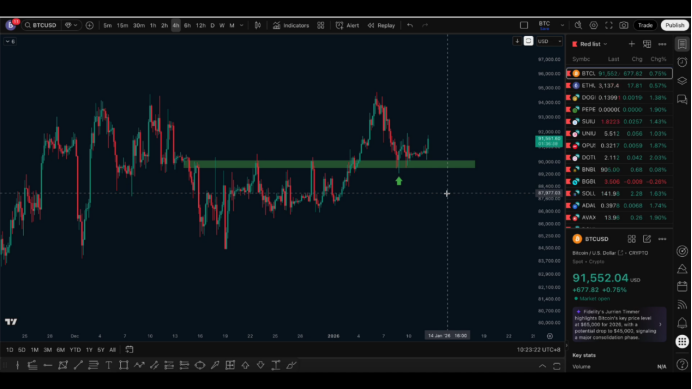
Based on this judgment, the main viewpoint given last week was:
If the price retraces to the 90,000 support range and does not form an effective breakdown, a bullish position can be considered.
The specific approach was clearly stated:
One can attempt to go long near 90,000.
The stop-loss point should be placed at the previous low.
If that low is effectively broken, the long position needs to exit.
Only light positions and low leverage are allowed.
VI. Current Profit and Loss and Response Strategy
From the current trend, this approach has already shown floating profits.
During the weekend, the price fluctuated around 90,000 plus a few hundred, currently having a profit space of about 1,000 points.
With existing profits, two points need to be noted:
Timely move up the stop-loss.
Focus on defense rather than blindly increasing positions.
If you have not participated yet, you can still try with a light position within the current range, with the stop-loss point still being the previous low.
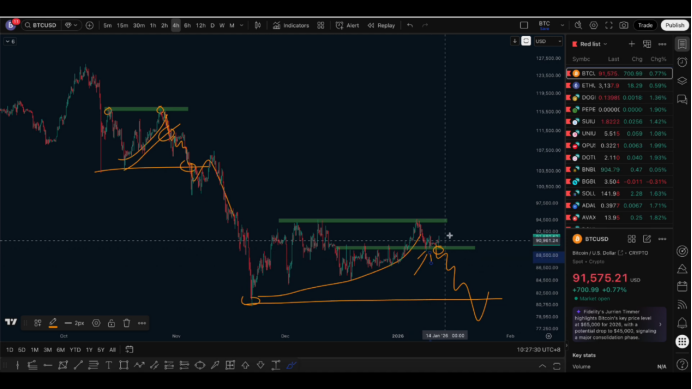
VII. What Happens If the Support is Broken?
If that low is effectively broken, there are mainly two possibilities:
The first: Trend reversal.
This adjustment phase ends.
The market re-enters a continuation of the long-term bearish trend.
It is important to note that long-term structures are often driven by short-term movements.
Once a change occurs in the smaller timeframe, it will directly impact the larger timeframe trend.
The second: Range consolidation.
The price operates below the high and above the low.
It may consolidate around 84,000 for a longer period.
However, in terms of probability, this situation is relatively small.
The greater possibility is that once the support is broken, the bearish trend continues.
VIII. Current Conclusion: Support Not Broken, Continue Bullish
It needs to be emphasized:
The current price is still operating above the support.
Before the support is broken, we will not prematurely turn bearish.
The current judgment remains:
Above the support level.
Continue to look for a rebound upwards.
Expect the continuation of the bullish trend.
From a structural perspective, this is:
Upward → Pullback → Upward again.
The next upward target still points to 94,000.
IX. Explanation of Higher Targets
It has been mentioned before that the market does not rule out further upward movement to:
98,000 – 99,000
Or even breaking through the integer level of 100,000.
Based on the equidistant upward structure calculation, a high point around 99,000 is reasonable.
At the same time, it should be noted:
94,000 was only tested previously.
There has not been a clear and effective breakthrough.
For the bears, a full liquidation has not been completed.
Therefore, under the premise that the support is not broken, the possibility of breaking above 94,000 again exists.
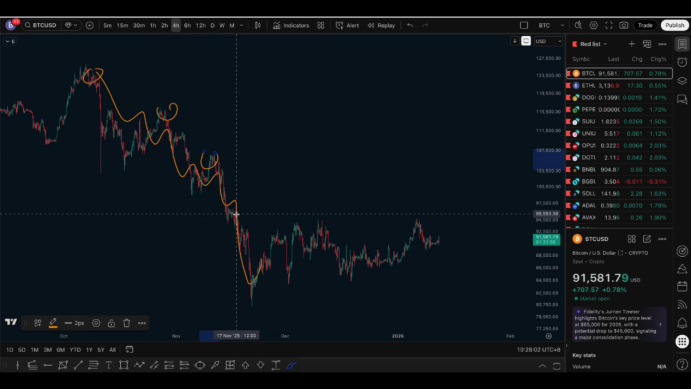
X. Why Not Wait for the Low to Break Before Turning Bearish?
Looking back at historical trends, it can be found that:
Some positions also formed pressure from a double top, with the overall center of gravity shifting upwards, but once the trend line is broken, the market quickly continues the original trend.
Once the trend line is effectively broken, a new trend often begins.
If you wait until the low is broken to confirm, you often miss a better position.
Therefore, for the current structure:
90,000 is the most critical watershed.
Once 90,000 is lost, the viewpoint will shift.
Before that, maintain a bullish judgment.
XI. Explanation of "Bullish and Bearish Views"
Here I will briefly explain my logic:
When the structure gives a clear signal, I will maintain a clear core viewpoint.
For example, during the previous downward phase, we were consistently and firmly bearish.
In the current phase, there are indeed multiple possibilities, but I will indicate which probability is greater.
Currently:
Both downward and consolidation possibilities exist.
But before the support is broken, I lean more towards the bullish expectation.
This is not a vague judgment, but rather:
If the conditions are not met, do not draw conclusions in advance; once the conditions are met, the viewpoint switches immediately.
Follow me, join the community, and let's progress together.

免责声明:本文章仅代表作者个人观点,不代表本平台的立场和观点。本文章仅供信息分享,不构成对任何人的任何投资建议。用户与作者之间的任何争议,与本平台无关。如网页中刊载的文章或图片涉及侵权,请提供相关的权利证明和身份证明发送邮件到support@aicoin.com,本平台相关工作人员将会进行核查。