Coin Waves: 1.16 Bitcoin (BTC) Market Analysis Reference:
Bitcoin price is under pressure and has entered a technical correction, with intraday trading fluctuating narrowly around the 95500 level.
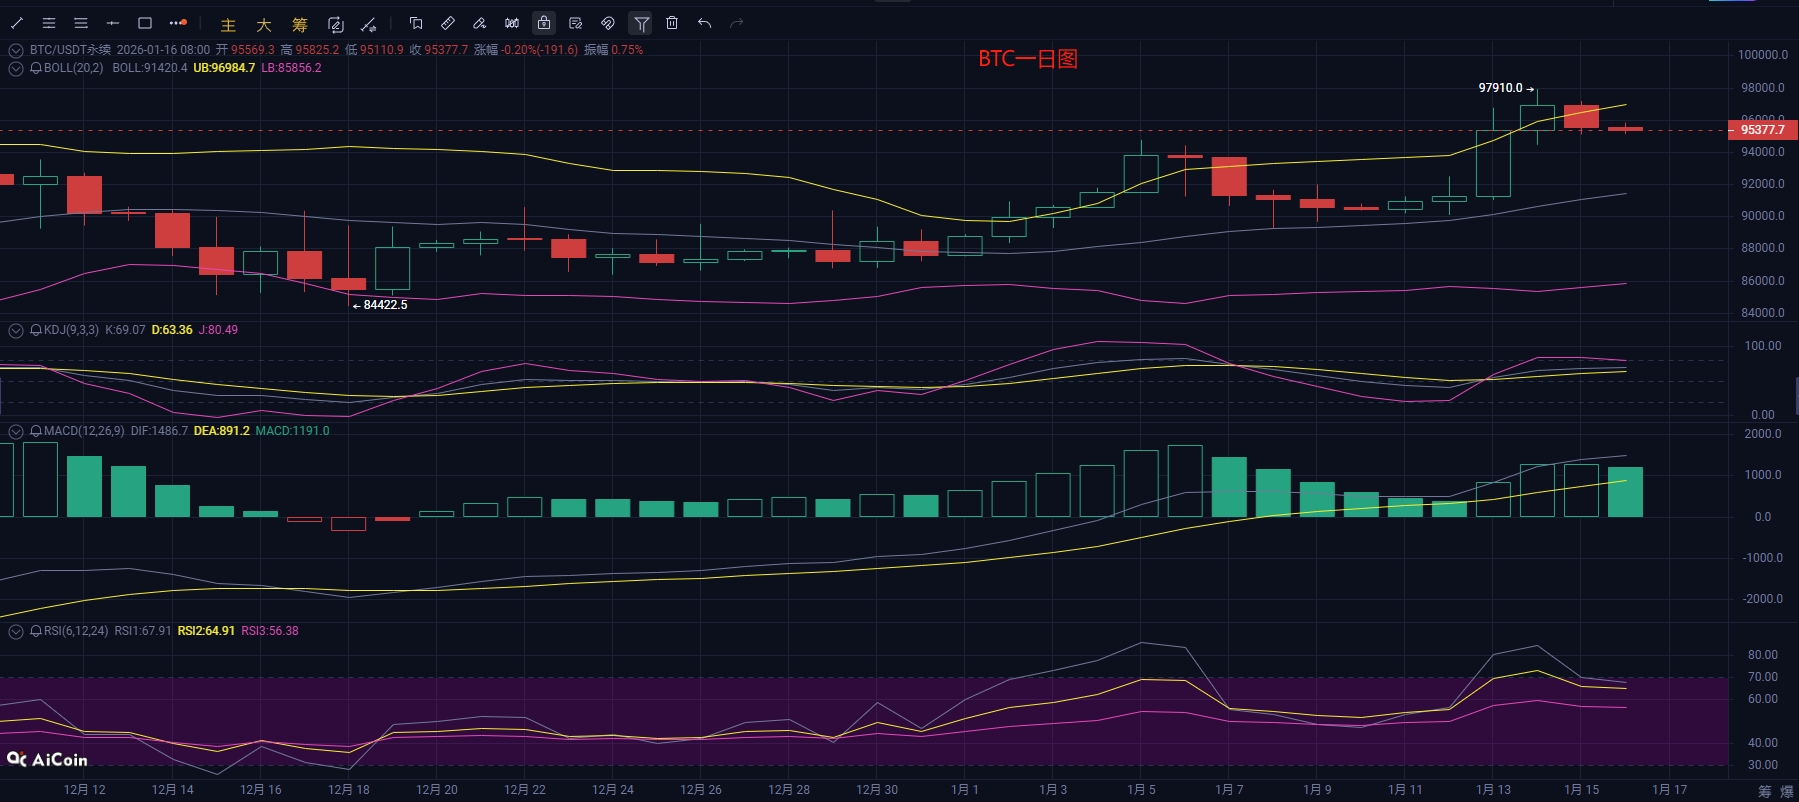
From the current daily chart, Bitcoin price has slightly retreated after reaching a recent high of 97900, currently operating below the upper Bollinger Band. The Bollinger Bands are showing an overall upward expansion pattern, indicating potential space above, but there is a short-term need for a pullback; the moving average system maintains a bullish arrangement, with EMA15 (92700) and EMA7 (94200) providing support for the price, and the medium to long-term trend is bullish. The KDJ indicator is currently in the high region, with the J line approaching the overbought zone, indicating a possibility of downward adjustment; in the MACD indicator, the DIF line continues to stay above the DEA line, and although the histogram remains positive, it shows a slight decrease in volume, indicating a weakening of bullish momentum; the RSI indicator has not yet entered the overbought zone, still possessing some upward momentum. Overall, the short-term market may face a technical correction, with support to watch in the 94000-95000 range. If the key support level can hold after the pullback, it is likely to continue a fluctuating upward trend, with a chance to challenge the 98000 level again.
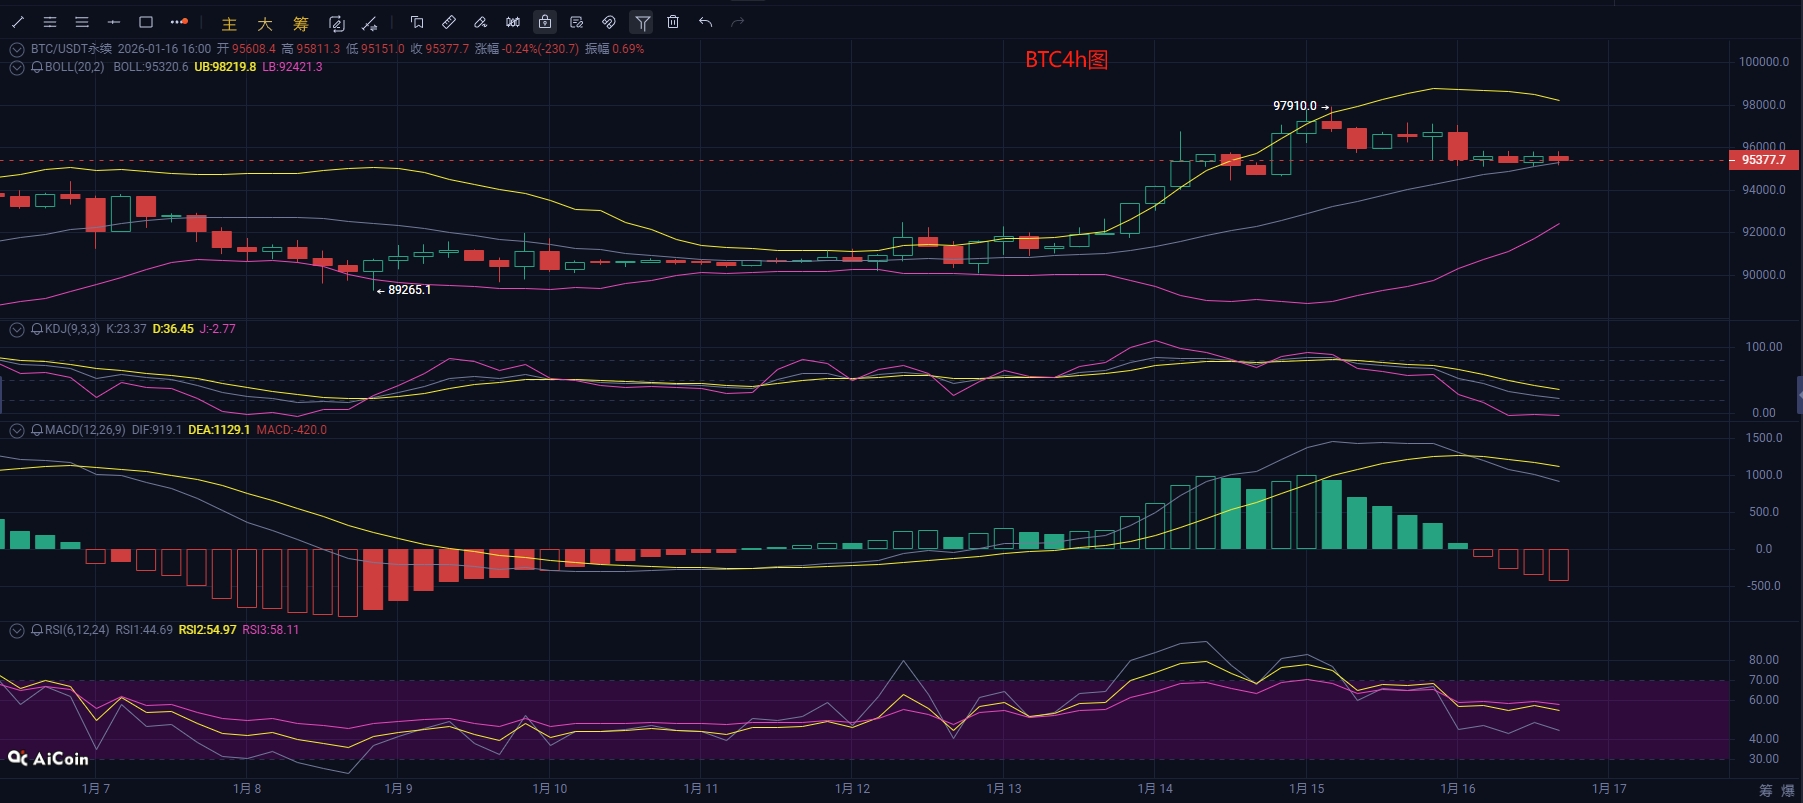
In the 4-hour and 1-hour short-term dimensions, the price is in a high-level pullback consolidation phase: in the 4-hour chart, the current price is operating near the middle Bollinger Band, with signs of narrowing in the Bollinger Bands, indicating that short-term fluctuations may converge; the KDJ indicator has retreated from the high, with the J line entering the negative region, suggesting expectations for an oversold rebound, but no clear turning signal has appeared yet; in the MACD indicator, the fast and slow lines have formed a death cross and are continuing to expand, indicating that short-term bearish momentum is being released, with EMA20 (95000) becoming the current key support.
In the 1-hour chart, the Bollinger Bands are narrowing downwards, with the price below the short-term MEA moving average. The KDJ indicator has retreated, with the J line entering a neutral low region, indicating a technical rebound demand; the MACD remains negative, with the DIF and DEA close to convergence below the zero axis, with a death cross emerging. Overall, the short-term pullback is a correction under the daily bullish trend. If the 4-hour EMA20 and the 1-hour lower band (94800) support hold effectively, the price is expected to stabilize and rebound, challenging previous highs again. If the support fails, it may further test previous lows. Therefore, the suggested strategy is to short on rebounds and go long at lower levels if support breaks.
Coin Waves: 1.16 Bitcoin Short-term Reference:
Long Position: Buy in the 93500-94500 range, with a stop loss at 92500, targeting 95500-96500.
Short Position: Sell in the 97000-98000 range, with a stop loss of 500 points, targeting 96500-95500.
Coin Waves: 1.16 Ethereum Short-term Reference:
Short Position: Sell in the 3375-3425 range, with a stop loss of 30 points, targeting 3350-3300.
Long Position: Buy in the 3180-3230 range, with a stop loss of 30 points, targeting 3350-3400.
【The above analysis and strategies are for reference only. Please bear the risks yourself. The article may have delays in review and publication, and the strategies may not be timely. Do not operate blindly!】

The content of this article is originally shared by Coin Waves and represents personal opinions. The article may have delays in sending and is for reference only; do not operate blindly! If you want to get more daily real-time trades, follow my public account. Here, you can engage in online technical learning and understand knowledge related to exiting positions. I have years of research experience in the market, focusing on the major trends in the cryptocurrency space. I am mainly responsible for analyzing and guiding investment operations for BTC, ETH, DOT, LTC, FIL, EOS, BCH, ETC, and other coins. Welcome to study and research together.
I hope everyone on their investment journey can adhere to their principles, regardless of how the market changes. Stay rational and calm. Deeply understand the characteristics, risks, and return mechanisms of investment products, and do not let short-term market fluctuations affect your emotions. Be patient, avoid excessive greed and fear, and understand that wealth accumulation is a gradual process. Finally, I wish all my followers the ability to see opportunities in their investment journey, making every decision just right, sailing through the ocean of investment, and reaping wealth and growth!!!
免责声明:本文章仅代表作者个人观点,不代表本平台的立场和观点。本文章仅供信息分享,不构成对任何人的任何投资建议。用户与作者之间的任何争议,与本平台无关。如网页中刊载的文章或图片涉及侵权,请提供相关的权利证明和身份证明发送邮件到support@aicoin.com,本平台相关工作人员将会进行核查。