Ethereum #Bitcoin #Ethereum Real-time Analysis #Bitcoin Real-time Analysis
Hello everyone, I am Lao Lu. Yesterday, the bears swept through the market, and both cryptocurrencies showed a continuous bearish pattern on both the four-hour and hourly charts, with no rebounds throughout the decline. Ethereum dropped directly from $3368 to $2891, a decline of nearly $500 in just 48 hours. The daily level resistance remains strong, which is completely consistent with the pattern we discussed from October 7 to October 10 last year, both representing a complete daily level resistance. By referencing the entire daily trend from last October, we can roughly understand the direction of the future trend. The thought process is clear; the focus will still be on short positions, which is different from our previous strategy of high shorts and low longs. The daily trend has changed, and both cryptocurrencies have broken below the daily trendline support, effectively extinguishing the bulls. It is rare to see a continuous series of bullish weekly candles, and this week continues to show large bearish candles. If Ethereum can close above $2800 this week, then there may be a rebound next week. However, if it falls below this level by the weekend, it will likely accelerate down to the $2400 and $2110 levels next week. The $2110 level is crucial, and we have discussed it in detail in the pinned article. This article will not elaborate on that; having set the direction, the next issue is the entry point for short positions—whether to short directly or wait for a rebound to short.
For Bitcoin, the long-term bottom support at $91888 has rebounded once and then dropped again, breaking through directly. However, this is unavoidable. According to the previous daily trend, it has been a cycle of rising and falling, and it has been over a month without such a one-sided movement as we see now. We do not overly focus on bullish or bearish trends as they are normal; yesterday was precisely an anomaly. The trend on a changeover day cannot be determined, and before the changeover, we can only follow the established patterns. On changeover days, stop-losses become the norm, but how to grasp the subsequent trend is key. Bitcoin has shown a series of bearish daily candles, with yesterday closing with a large bearish candle. The hourly and four-hour charts have also shown a series of bearish candles, with the maximum rebound not exceeding $1000. The downward pressure is strong and terrifying! Based on the previous extremely weak trend, if it is going to drop today, a strong rebound is not allowed. The upper pressure levels are $91200 and $94000, but $94000 is too far. If it reaches that level today, the daily chart would show a large bullish candle, making it harder to drop. Therefore, shorting today should be slightly aggressive, targeting $91200. If it actually reaches this level, there could be a rebound of about $3000, but there is no other option; yesterday's drop was too significant. If we chase it directly, how much space is left for further declines becomes an unknown. It is better to wait for a rebound. If today continues to decline, then tomorrow we will continue to wait for an extremely weak rebound position to enter short. The lower support is at $84304, which is the closest support level I can see for the bulls from a technical perspective. There is no need to worry too much about space; if we consider the previous upward movement was not continuous, the probability of a significant breakdown on the next drop is also low. Therefore, even if it drops, we are not looking too far ahead for now, tentatively setting the major support near $84304.
Bitcoin short at $91200
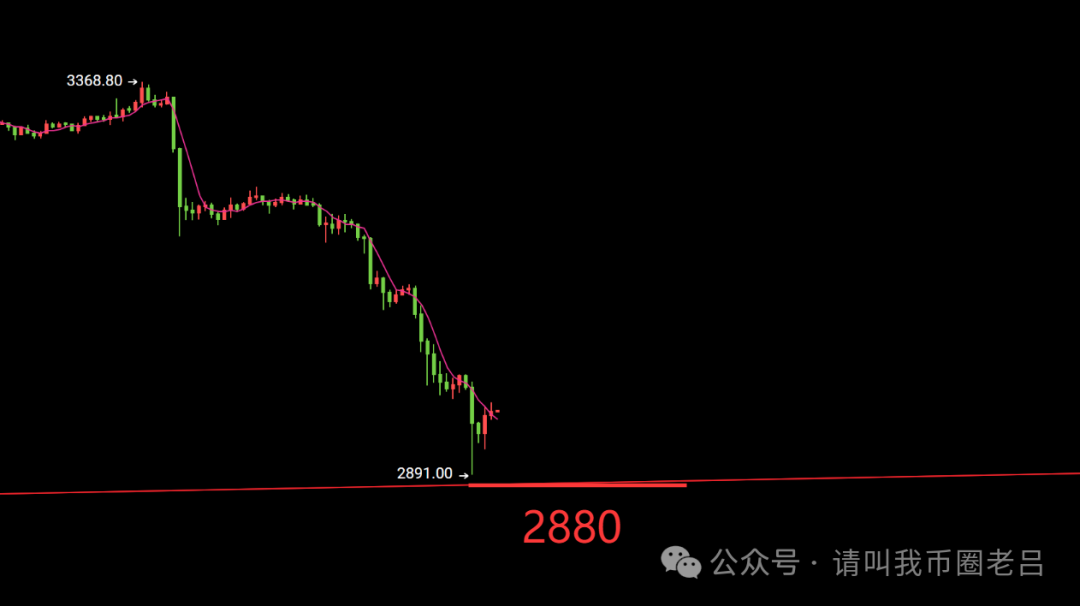
Ethereum, compared to Bitcoin, is even weaker. The weakness on the four-hour chart is comparable to a waterfall, with the starting point set at $3368. However, one point to note is that Ethereum is different; to open up the downward space, it must break below the daily support line at $2880 and the last upward starting point of this round at $2880, where both technical points overlap. Therefore, the short position is very limited. We can only adopt two modes: one is to short directly after a large bearish candle on the four-hour chart breaks through $2880 to around $2840, followed by a small rebound near $2880. The other is to rely on the $2880 support to first look for a rebound and then short. I need to explain the reason for this approach; it mainly stems from uncertainty about whether the support level at $2880 can be successfully broken. If it holds, being aggressive in shorting would not have a price advantage. However, going long seems a bit counter-trend. The previously explained aggressive breakdown shorting method has been clarified. The main focus is still on how to choose the price for shorting after a rebound. The target is set around $3070 for two main reasons: the last upward movement had a continuous support level at $3050 for a week, and after breaking this level, it turns into strong resistance. The first pressure point is $3050. The last reason is that the four-hour chart shows a series of bearish candles, with each candle being full-bodied and no bullish candles appearing, which is a standard for judging an extremely weak market. Therefore, in terms of operation, we do not wait for any form of large rebound; the price only needs to be at the 0.382 level of the downward pattern to enter. Thus, the pressure level is set at $3070, with the overall shorting range being $3050-$3070. However, we also do not rule out the possibility that the price may not rebound at all and continue to decline deeply. In that case, we can only proceed with the previously mentioned aggressive breakdown shorting strategy. The next effective support I can see is $2750, with $2440 and $2110 still being the prices mentioned in the pinned article, which are too far away.
Ethereum short near $3070
Today: Written by Lao Lu on January 21, 2026, at 10:02 AM. Please note that all strategies are effective once and cannot be reused! Check the text version and specific entry prices in the lower right corner of the image or video.
免责声明:本文章仅代表作者个人观点,不代表本平台的立场和观点。本文章仅供信息分享,不构成对任何人的任何投资建议。用户与作者之间的任何争议,与本平台无关。如网页中刊载的文章或图片涉及侵权,请提供相关的权利证明和身份证明发送邮件到support@aicoin.com,本平台相关工作人员将会进行核查。


