Qinglan Crypto Class is starting! BTC's four cycles + dual perspective on news, guiding you to step in sync with the crypto market rhythm.
Multi-cycle technical and news analysis
Long-term trend (daily - bearish but close to key support) The daily chart is very clear, dominated by bears. The price has effectively broken below the MA20 moving average (around 92,400) and the rising trend line since last December, which is an important defense line for long-term bulls. Yesterday (January 20), the large bearish candle with high volume directly smashed through multiple psychological levels of 90,000 and 89,000, which is very demoralizing. After the MACD formed a death cross at a high position above the zero axis, the fast and slow lines have crossed below the zero axis, and the green bars continue to expand, indicating strong bearish momentum. However! We need to pay attention to two key points: first, the price has dropped to the lower support area of the fluctuation range from last December (around 87,000-88,000), where historically there has been buying support. Second, the RSI has dropped to 43.6; although it hasn't reached oversold levels, it has already left the strong zone. Combined with the news perspective, the market sentiment index has fallen to "extreme fear" (24), altcoins are bleeding, and the overall network computing power is declining, all indicating that panic selling has emerged. Historical experience tells us that such times are often not far from a short-term rebound.
Mid-term trend (4-hour - weak rebound in a downtrend) The 4-hour chart more intuitively shows the severity of this round of decline. From the high point of 97,000+ on January 14, it has dropped to 87,000+ with almost no significant rebound. All moving averages (MA5, MA10, MA20) are in a perfect bearish arrangement, and the price is firmly suppressed. The MACD fast and slow lines are deeply underwater; although the green bars show signs of shortening, the absolute value remains large, indicating that the downward momentum has only slightly weakened, not reversed. The good news is that the last two 4-hour candlesticks (08:00, 12:00) have formed a "pregnant line" pattern in the 87,800-89,600 area, and the MACD green bars have started to shorten, which may be a preliminary signal of exhaustion in the downward momentum. The resistance level is first seen at 90,000-91,000 (previous small platform and MA5 moving average pressure).
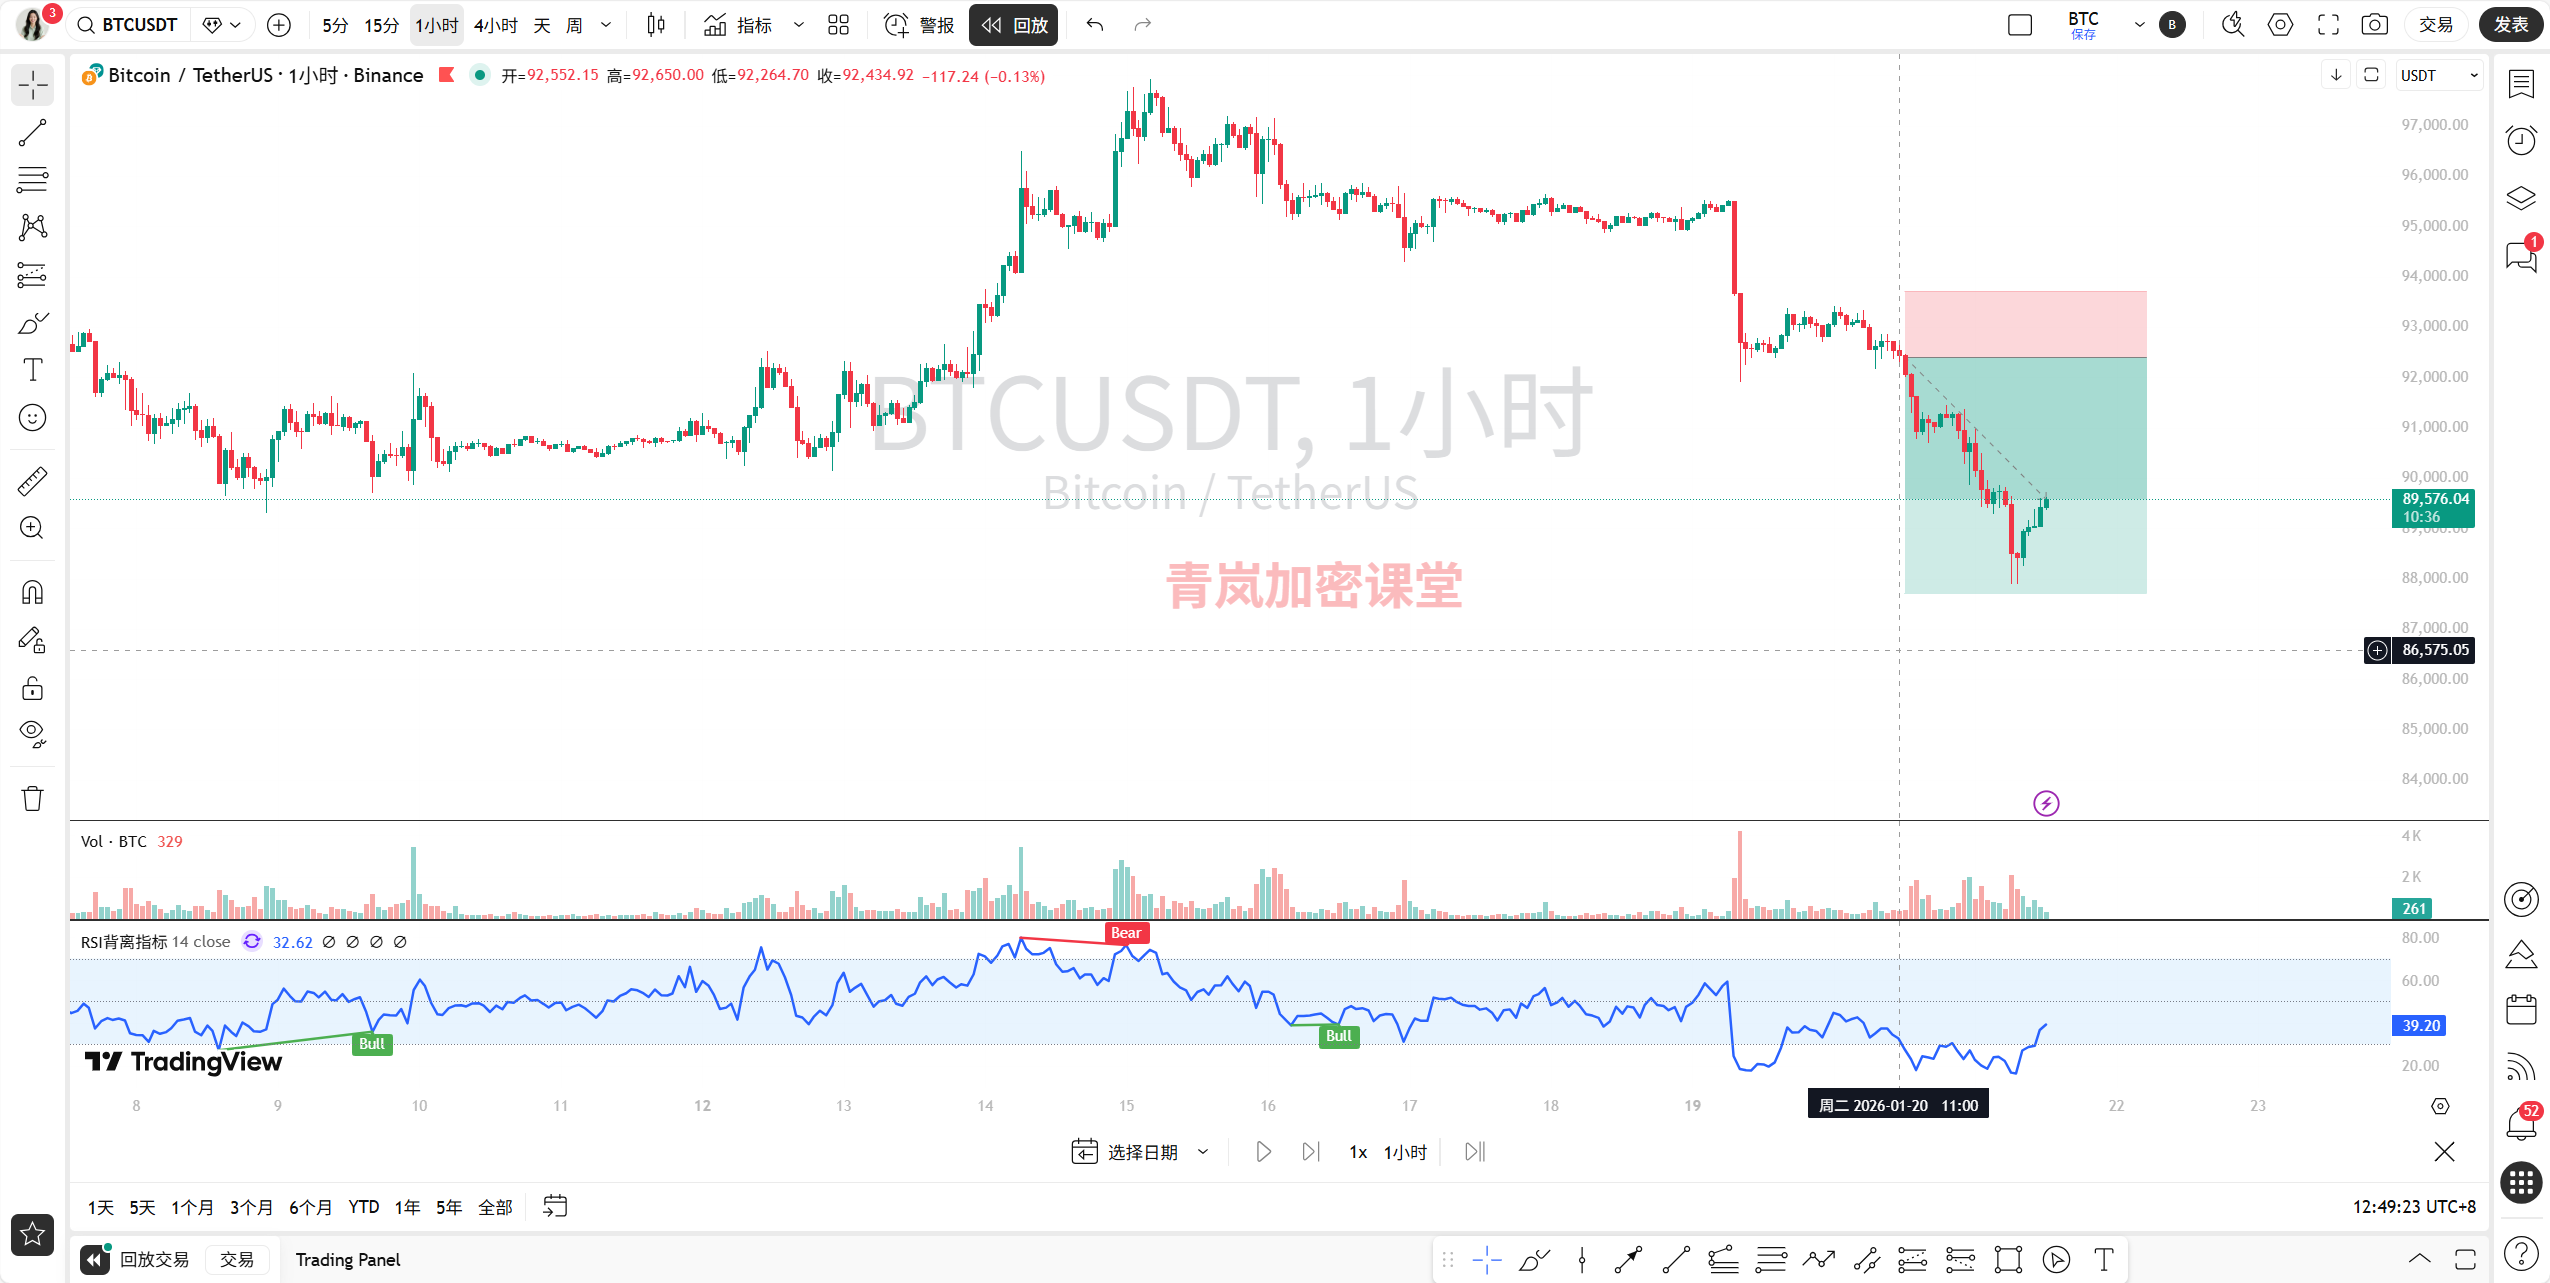
Short-term trend (1-hour & 15-minute - ongoing oversold rebound) The short cycle has finally shown some positive signals. On the 1-hour chart, after the price created a low around 87,800 in the morning, it began to oscillate upward. More importantly, the 1-hour MACD formed a golden cross deep underwater, and the red bars have turned green, which is a standard rebound signal triggered by a bottom divergence. The 15-minute chart also aligns well, with the MACD golden cross continuing upward, and the price standing above the short-term moving averages. What does this indicate? It indicates that under the backdrop of the daily and 4-hour downtrends, the short cycle has accumulated the technical demand for an oversold rebound. The bearish force has temporarily encountered resistance in the 87,800-88,000 area, with some bottom-fishing funds and short covering entering the market.
Comprehensive prediction and trading ideas
Prediction: The market is currently in the "short-term oversold rebound within a long-term bearish trend" phase. The bearish structure of the larger cycles (daily, 4-hour) has not been broken, but the technical rebound of the smaller cycles (1-hour, 15-minute) has already started. The first target for the rebound is seen at the 90,000-91,000 area, where the 4-hour MA5 and the previous small platform overlap as a pressure zone. If it cannot break through here, then after the rebound ends, it is likely to test the strength of the key support at 87,000-88,000 again. Once this level is lost, the space below will be opened up.
Trading ideas (for educational reference only):
Aggressive (catching the rebound): Consider lightly entering long when the price retraces to the 88,500-89,000 area and the 15-minute chart does not create a new low. Strictly place a stop loss below 87,800. The target is set towards 90,000-91,000, treating this as a rebound within a downtrend, and do not linger in the trade.
Conservative (trading with the trend): Wait for the rebound to reach the 90,500-91,000 pressure zone, and observe for signs of stagnation (such as long upper shadows, shortening of the 1-hour MACD red bars) before considering entering short. Place a stop loss above 91,500. This is an operation in line with the major trend, potentially offering a better risk-reward ratio.
Wait-and-see: If the price directly breaks below 87,000 with high volume, do not easily bottom-fish; wait for clearer signals of a stop in the decline.
Remember, the current market is shrouded in risk-averse sentiment (U.S. stock market crash, trade war concerns), and negative news may suppress technical rebounds at any time. Therefore, positions must be light, and stop losses must be decisive.
For more quantitative breakdowns of how real-time news affects market sentiment, updates are available on my Qinglan Crypto Class, www.qinglan.org. Finally, I leave you with a trading maxim: "Under the waterfall, patience is more precious than gold; during the rebound, discipline is more important than profit." Let's maintain our mindset and respond calmly.
免责声明:本文章仅代表作者个人观点,不代表本平台的立场和观点。本文章仅供信息分享,不构成对任何人的任何投资建议。用户与作者之间的任何争议,与本平台无关。如网页中刊载的文章或图片涉及侵权,请提供相关的权利证明和身份证明发送邮件到support@aicoin.com,本平台相关工作人员将会进行核查。


