Li Ying in the Cryptocurrency Circle: Bitcoin (BTC) Latest Market Analysis
Article Published on 2026.1.22-----00:50
The current price of Bitcoin is 89,300. Li Ying's strategy of buying at low levels remains unchanged. When the market reaches key support, considering a long position is advisable. Currently, the daily chart has been continuously retreating from high levels, but there are signs of support around 88,000, leading to a slight rebound. The 2-hour candlestick chart shows a downward trend, with the current closing price of 89,380 approaching the previous low area. The MACD on the daily chart is in a bearish state, while the 2-hour chart may form a golden cross signal. The EMA on the 2-hour chart indicates clear short-term pressure, but Li Ying believes the medium to long-term trend is shifting towards a bullish outlook. Currently, the trading volume fluctuates, and the main force is clearly washing out positions to prepare for a stretch, so the strategy is primarily bullish.
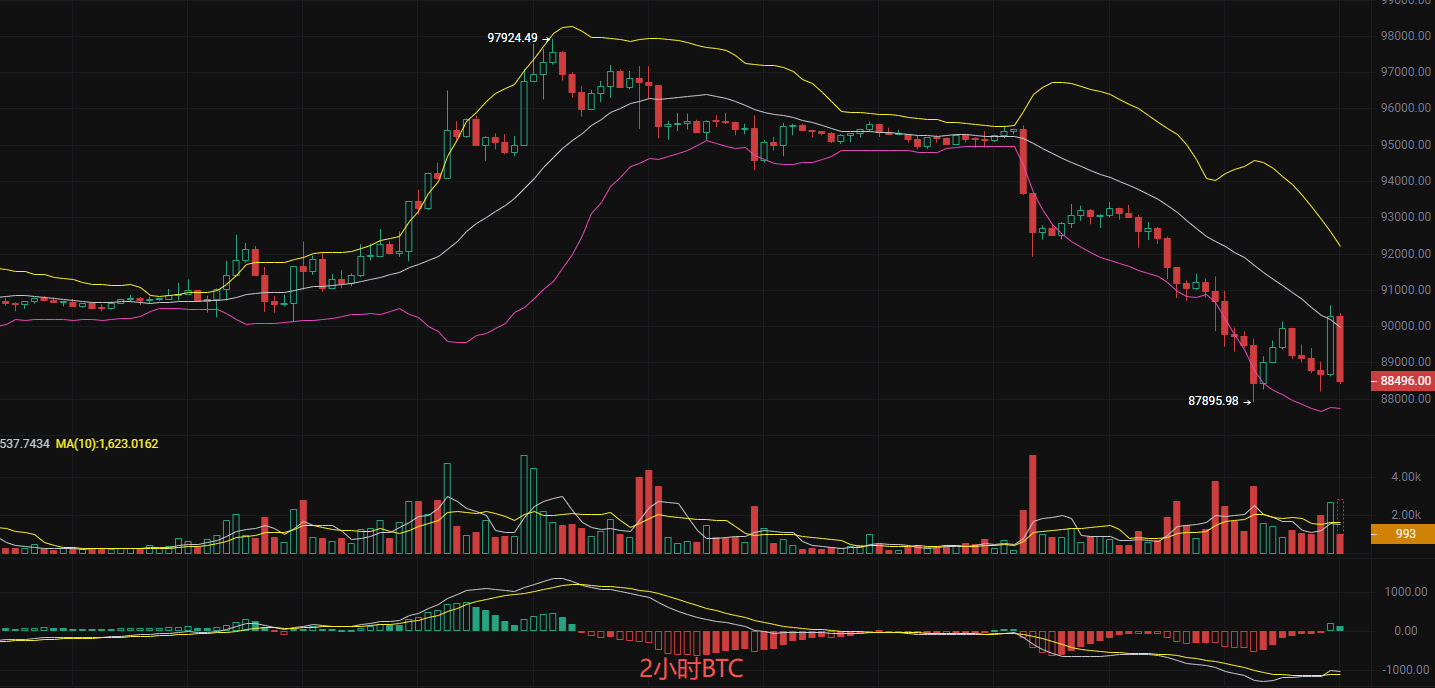
Short-term Reference:
- For long positions: 88,000 and 87,000, exit if it falls below 86,500, target above 91,000 aiming for 91,500.
- For short positions: 91,000 and 91,500, exit if it falls below 92,000, target below 90,500 aiming for 89,500.
Ethereum (ETH) Latest Market Analysis
Before publication, the current price of Ethereum is 2,930. Li Ying's strategy has shifted to a bullish outlook. The reason is simple: the main force has deeply washed out positions and has reached key support. Currently, the 2-hour chart is fluctuating around 2,960, forming a slight pullback trend. There is significant selling pressure near the previous high of 3,005. The daily chart shows a recent decline from above 3,200 to the 2,900 area, indicating a downward trend, but there are signs of stabilization. The MACD on the 2-hour chart is in a low-level golden cross, and the RSI is close to the oversold range, suggesting a potential technical rebound in the short term. Although the EMA on the 2-hour and daily charts indicates a bearish outlook, the values are relatively low, indicating a need for recovery. Overall, Li Ying suggests focusing on long positions at low levels, with short positions as a supplement.
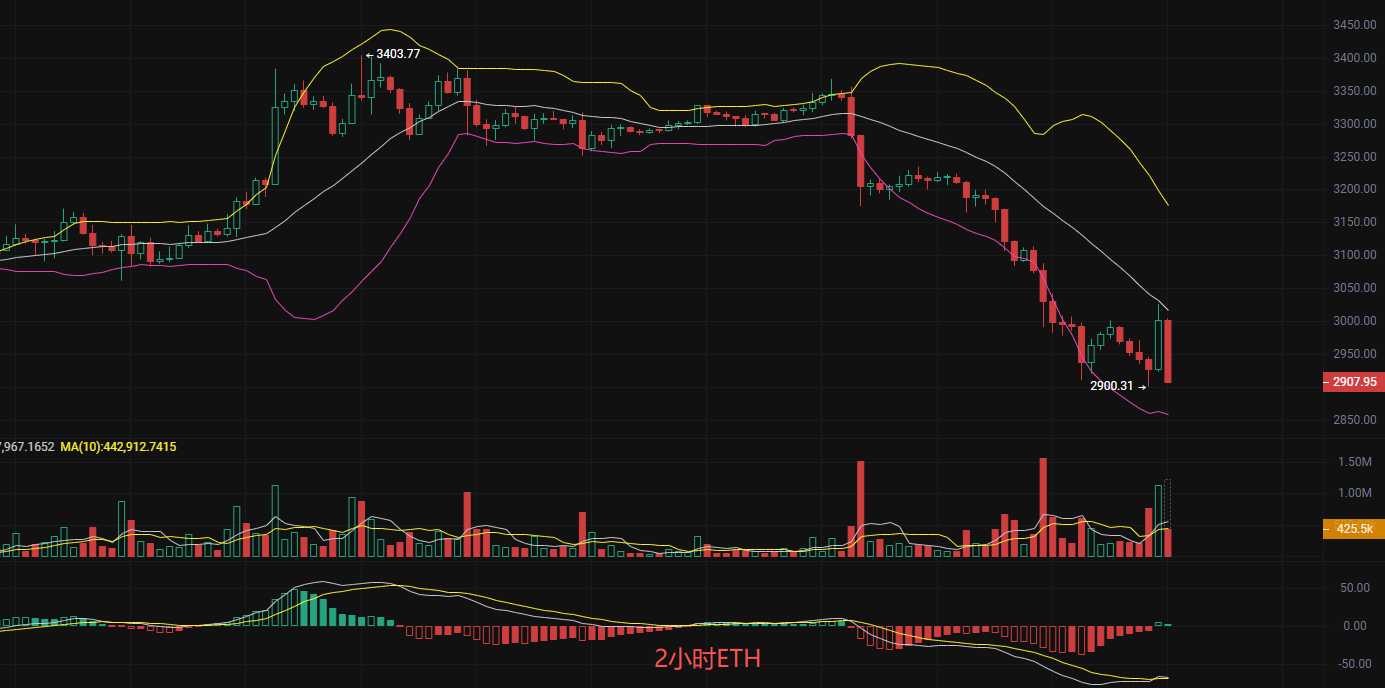
Strategy Reference:
- For long positions: 2,900 and 2,950, exit if it falls below 2,820, target above 3,000 aiming for 3,100.
- For short positions: 3,100 and 3,150, exit if it falls below 3,180, target below 3,000 aiming for 2,950.
The above content is exclusively original by Li Ying. Please indicate the source when reprinting! Article publication review may have delays, and the market changes rapidly. The above suggestions are for reference only, and risks are borne by the reader. We hope Li Ying's insights will be helpful to you!

The content of the article is time-sensitive and for reference only; risks are borne by the reader.
免责声明:本文章仅代表作者个人观点,不代表本平台的立场和观点。本文章仅供信息分享,不构成对任何人的任何投资建议。用户与作者之间的任何争议,与本平台无关。如网页中刊载的文章或图片涉及侵权,请提供相关的权利证明和身份证明发送邮件到support@aicoin.com,本平台相关工作人员将会进行核查。