Technical Analysis: Multi-Period Resonance, Key Focus Here!
Daily Chart (Long-Term Trend - Weak Fluctuation): The price is still oscillating within the large range of 85,000-98,000 from last November. Currently, the price (around 90,300) is being firmly pressed by MA20 (92,431), and MA5 has also crossed below MA10, indicating the emergence of a bearish arrangement. The MACD has formed a dead cross above the zero line, with green bars shortening, showing a significant reduction in upward momentum. The key support is at the lower edge of the range, 85,000-86,000, which is critical for bulls; the upper resistance is first at MA20 around 92,400, with strong resistance near the upper edge of the range at 98,000.
4-Hour Chart (Medium-Term Trend - Oversold Rebound): After a brutal drop from 97,000 to 87,300, the market is currently experiencing a weak rebound. The MACD shows signs of a golden cross at a very low position (below -1200), and the green bars are starting to shorten, which is a typical technical recovery after being oversold. However, the moving average system (MA5/10/20) is in a bearish arrangement, and the first hurdle for the rebound is the combined resistance zone formed by MA5 (around 89,800) and MA10 (around 89,700). Key support is near the previous low of 87,300, with resistance seen in the 90,500-91,500 area.
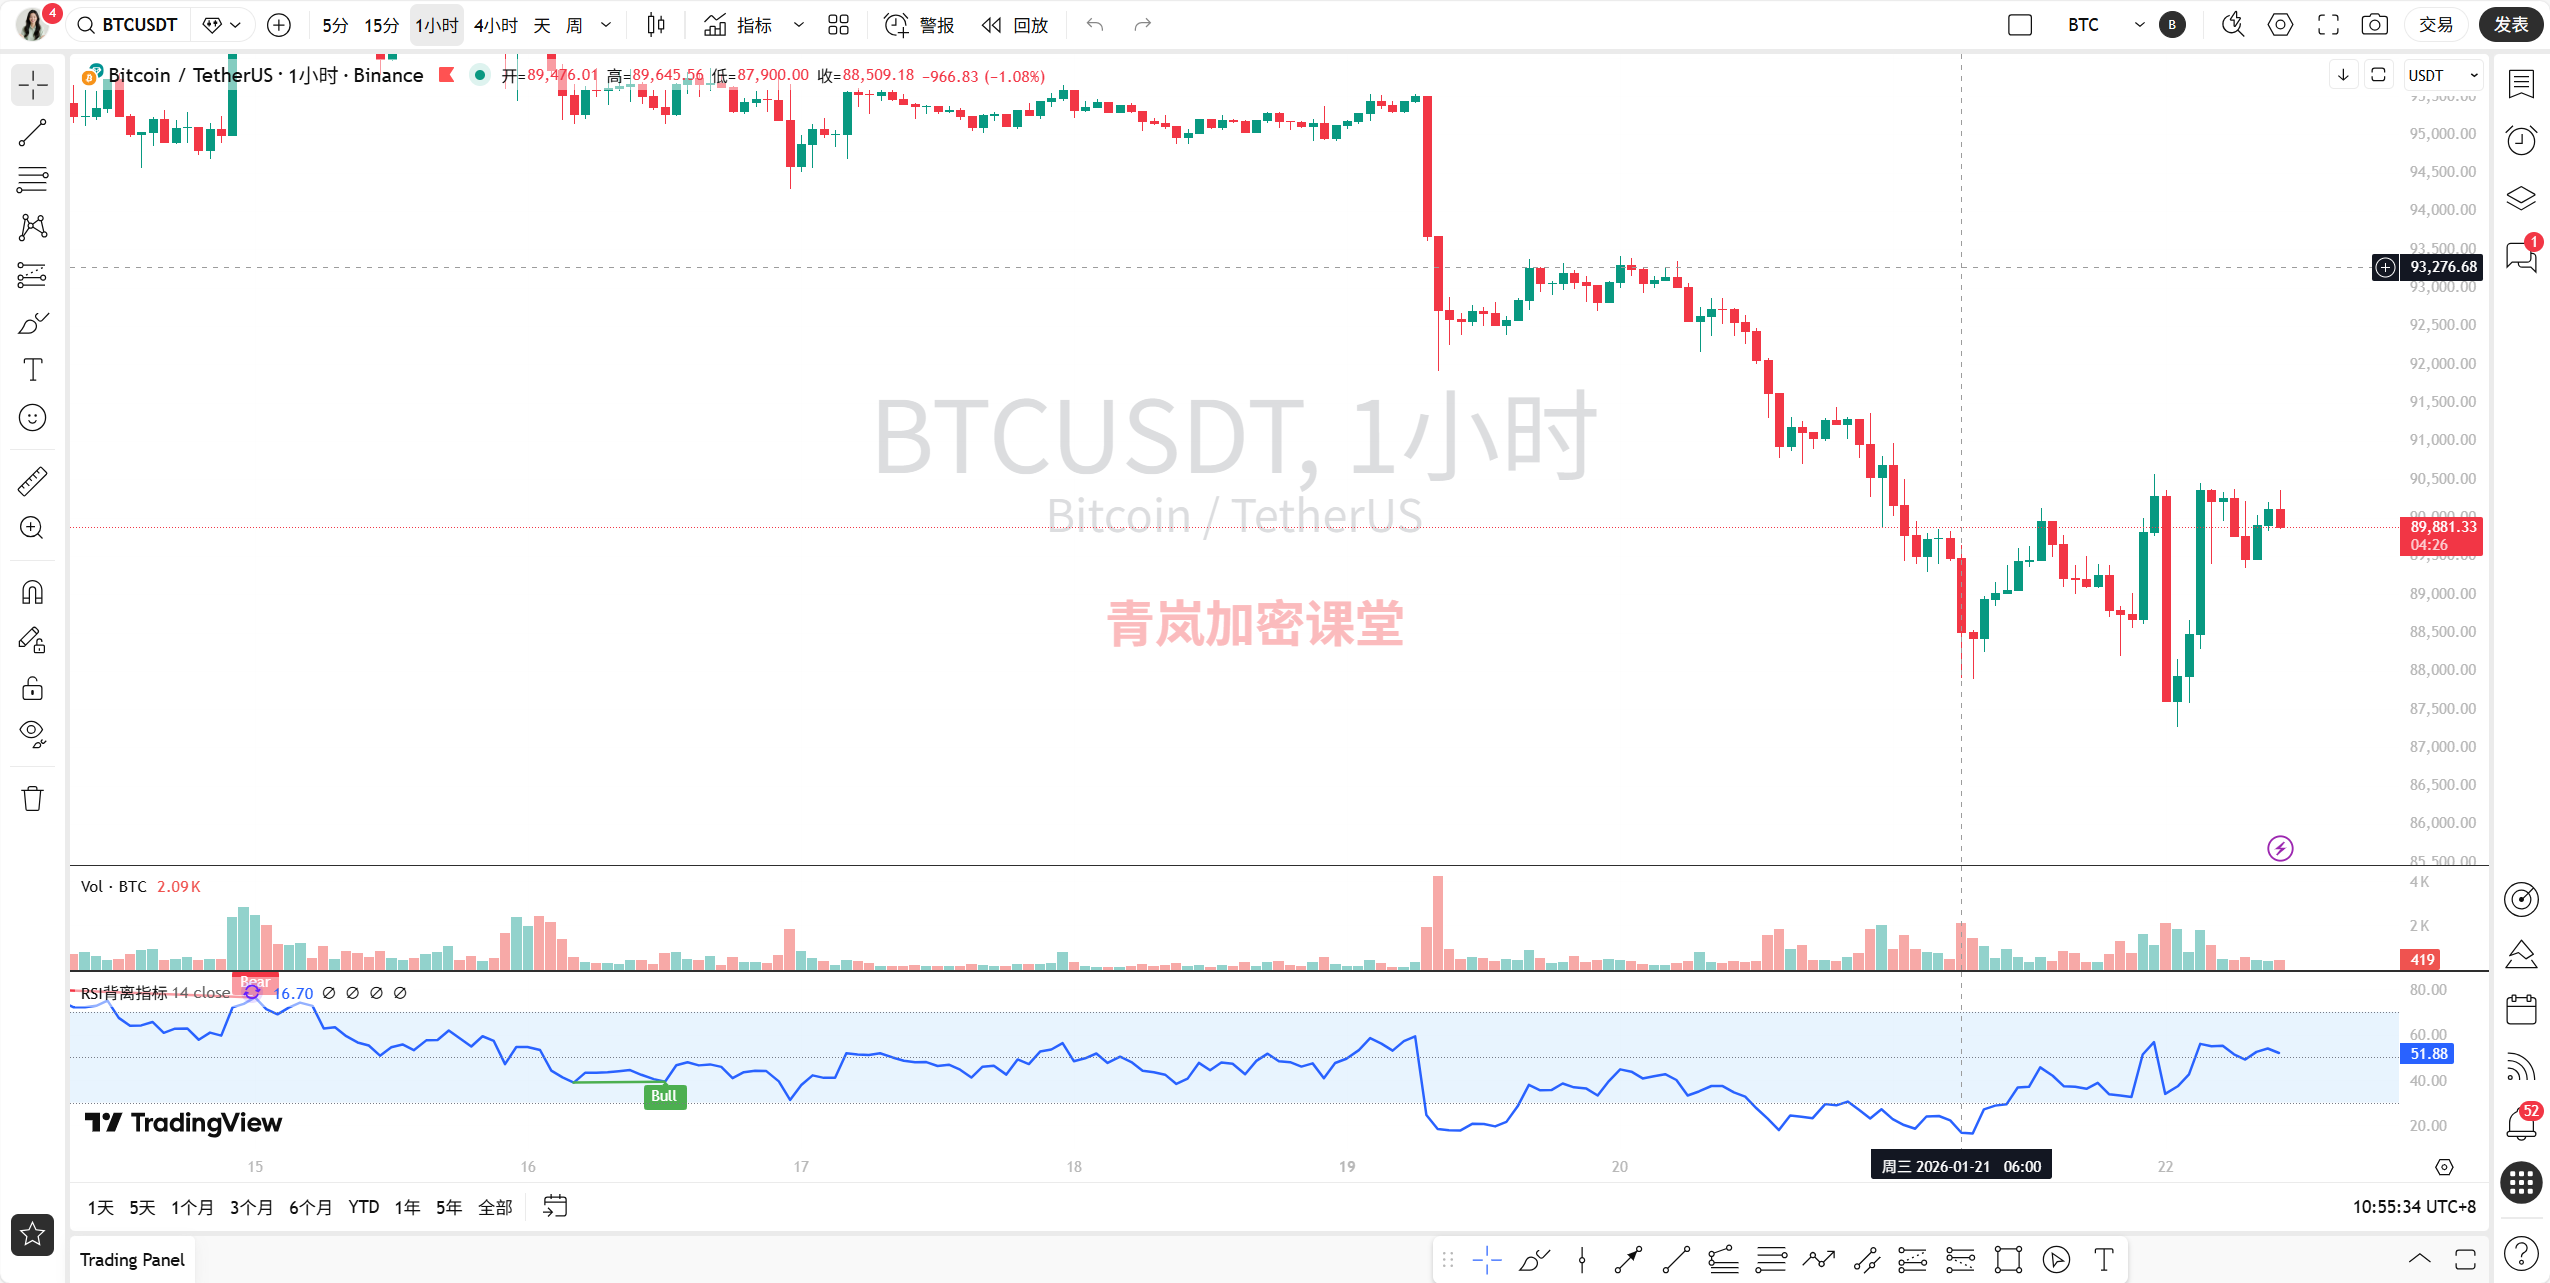
1-Hour Chart (Short-Term Trend - Fluctuating Bottom Formation): The trend is clearer than the 4-hour chart. After last night's sharp drop, a double bottom formed near 87,300, followed by a strong rebound to 90,300. The MACD has formed a golden cross below the zero line and is rising quickly, reflecting short-term rebound momentum. Currently, the price is oscillating narrowly between 89,800-90,300, digesting profit-taking and previous trapped positions. Short-term support is at 89,500 (MA20), with strong support at 88,800 (double bottom neck line); upper resistance is at 90,500 and 91,200.
15-Minute Chart (Ultra-Short-Term - Seeking Direction): This is a complete reflection of a news-driven and sentiment-driven market! Last night, stimulated by the news of "Trump suspending tariffs," a huge bullish candle violently surged, but then quickly retraced, forming a typical "news pulse" pattern. Currently, it is struggling near the lower boundary of an ascending channel (around 90,000). The MACD shows signs of a top divergence, indicating insufficient upward momentum in the short term, requiring a pullback to gather strength. Ultra-short support is at 89,800; if it breaks, a pullback to 89,200 may occur.
News Front: Macroeconomic Sentiment "Roller Coaster," Market Extremely Sensitive
The news front is very lively, summarized in one word: speculation.
Macroeconomic Factors Drive Short-Term Volatility: Trump's comments on tariffs (suspension vs. possible implementation) directly led to over $1 billion in liquidations last night and a V-shaped price reversal. This indicates that current market sentiment is completely driven by macro policies, and any slight movement can trigger huge shocks.
Long-Term Narrative Remains Unchanged: ARK Invest has set a target of $800,000, BlackRock emphasizes Ethereum's leading position in asset tokenization, and Vitalik Buterin returns to decentralized social media, all reinforcing the long-term value logic of crypto assets. However, distant water cannot quench immediate thirst.
Market Structure is Fragile: The overnight massive liquidations indicate that leverage remains high, and the market is like a tightly stretched string. Meanwhile, analysts warn that before the price returns to 98,000 (the cost line for short-term holders), the foundation for upward movement is not solid.
Clear Sector Divergence: Solana, Ethereum, and others are facing technical pressure (news 9, 18, 23), with funds rapidly rotating, indicating a lack of a unified and sustained bullish narrative in the market.
Comprehensive Forecast and Trading Ideas:
Core Judgment: Short-Term Fluctuating Rebound, Mid-Term Trend Unclear, Beware of Re-testing Bottoms.
Trend Direction: Short-Term (1-3 days): Fluctuating rebound. Based on the oversold recovery and MACD golden cross on the 4-hour and 1-hour charts, there is a demand for the price to rebound to the 91,000-92,000 area. Mid-Term (1-2 weeks): Direction unclear, cautious bias. The bearish arrangement and range fluctuation on the daily chart have not changed. If the rebound cannot effectively break through 92,400 (daily MA20), it will still be a continuation of the downtrend. Long-Term (over 1 month): Depends on the defense of the lower edge of the 85,000-86,000 range. If defended, it will maintain a large-scale fluctuation; if lost, it will initiate a deeper adjustment.
Key Levels and Reversal Patterns: Key Support: 89,500 (1-hour MA20) -> 88,800 (double bottom neck line) -> 87,300 (previous low/lifeline) -> 85,000 (lower edge of the range/ultimate defense line). Key Resistance: 90,500 (4-hour MA5/psychological level) -> 91,500 (January 21 high point area) -> 92,400 (daily MA20/bull-bear dividing line). Potential Reversal Patterns: Pay attention to the formation of "head and shoulders" or "double bottom." Currently, the 1-hour chart has a nascent "double bottom," but the right shoulder has not yet been confirmed. If the price breaks through 91,500 with volume and stabilizes, the double bottom pattern will be established, and the rebound will look higher. Conversely, if it breaks below the 88,800 neck line, the pattern will fail, and the downtrend will resume.
Trading Ideas (for reference only, risk at your own discretion): Aggressive Long Position (Short-Term): Lightly test long in the 89,500-89,800 area, with a stop loss below 88,800, targeting 90,500 and 91,200. Quick in and out, betting on the rebound. Conservative Long Position (requires confirmation): Wait for the price to break through and stabilize at 91,500, then enter on a pullback that does not break, with a stop loss below 90,500, targeting 92,400. This is a right-side confirmation signal. Short Position Idea: If there are signs of stagnation in the resistance zone of 92,000-92,400 (such as long upper shadows, MACD top divergence), a light short can be tested, with a stop loss above 92,500, targeting 90,500 and 89,500. Current counter-trend requires stricter stop losses. Core: All trades must have stop losses! The current market is greatly influenced by news, with violent fluctuations; position management is the top priority. Before the daily chart clearly establishes a direction, focus on short-term, small positions, and high flexibility strategies, and do not easily bet on mid- to long-term directions.
Disclaimer: This analysis is for reference only and does not constitute any investment advice. The cryptocurrency market is highly volatile; please make independent judgments and manage risks. Due to the timeliness of market analysis, the latest analysis results are subject to the official website of Qinglan Crypto Classroom! https://www.qinglan.org/
Finally, I would like to share today's insight: "In the turbulent waves of news, technical charts are your anchor; and among the intricate lines of the charts, strict discipline is your life jacket." Stay calm, trade according to plan, and we can navigate this sea steadily and far. That's all for today's morning analysis; wishing everyone successful trading!
免责声明:本文章仅代表作者个人观点,不代表本平台的立场和观点。本文章仅供信息分享,不构成对任何人的任何投资建议。用户与作者之间的任何争议,与本平台无关。如网页中刊载的文章或图片涉及侵权,请提供相关的权利证明和身份证明发送邮件到support@aicoin.com,本平台相关工作人员将会进行核查。