Liying in the Crypto Circle: Latest Bitcoin (BTC) Market Analysis
Article Published on 2026.1.23-----00:30
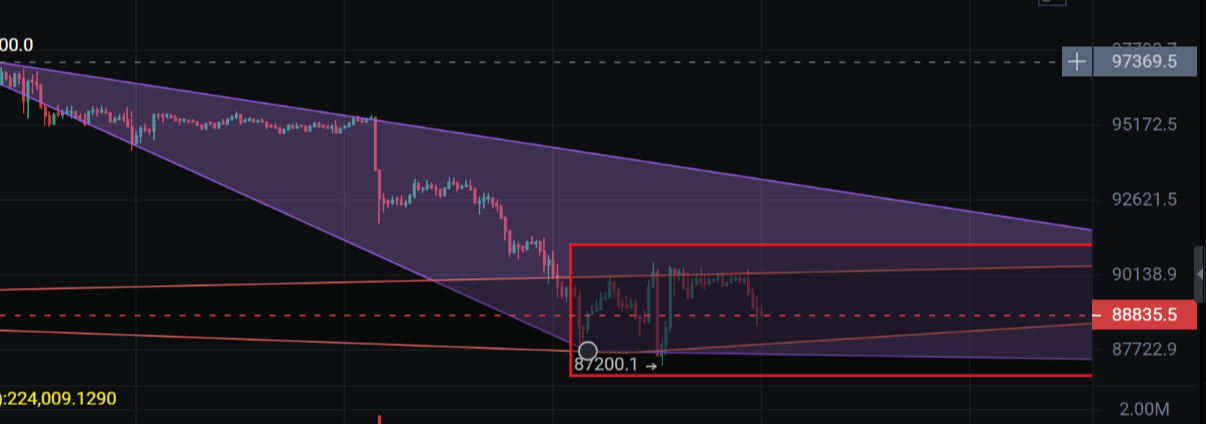
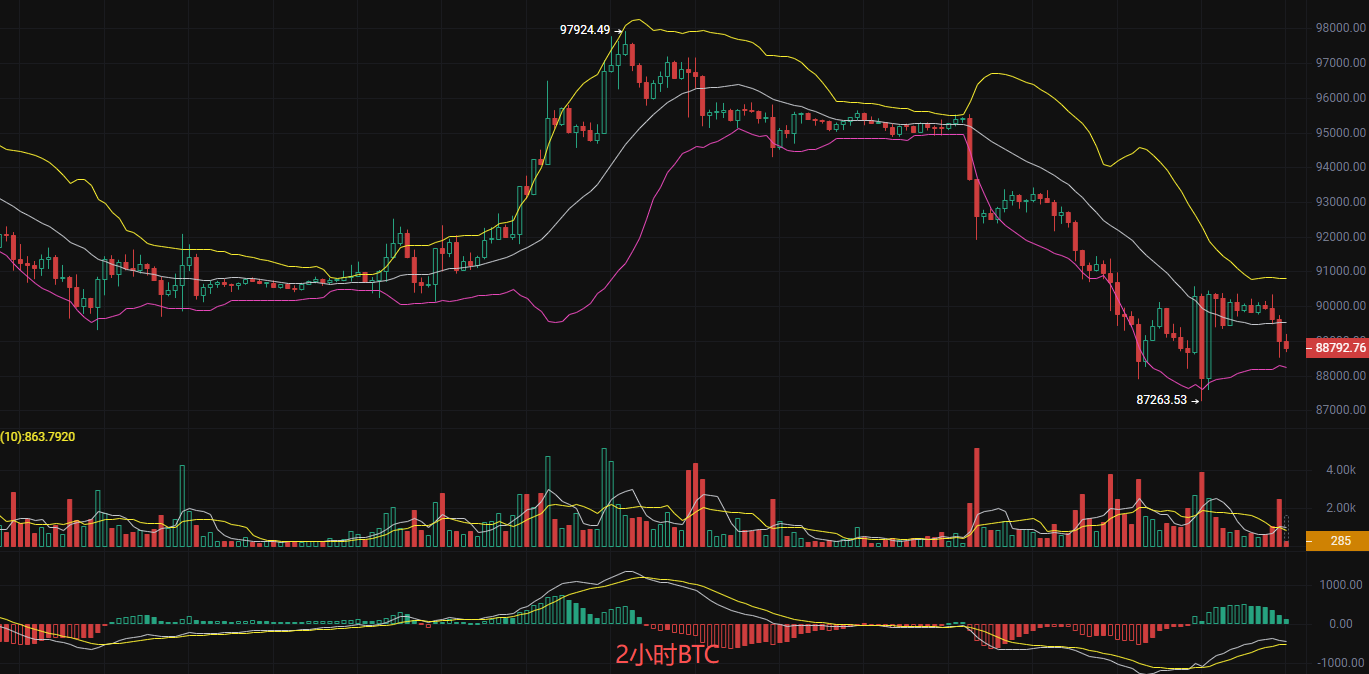
The current price of Bitcoin is 88,800. Liying reminded everyone yesterday to buy at lower levels, starting from 87,000 all the way up to 90,000. The strategy remains the same, focusing on buying at lower levels. Currently, the daily chart is gradually narrowing and showing signs of a rebound, but it has not broken through the previous high. The 2-hour candlestick chart shows alternating bullish and bearish patterns, indicating significant downward pressure in the short term, with the current price close to the 88,771 integer level. The MACD on the 2-hour chart shows weakening bullish momentum but still remains dominant. The RSI on the 2-hour chart is leaning towards the oversold zone, indicating a possibility of a rebound, but overall it still leans towards weakness. The EMA trend is currently in a foundational stage at the bottom. Overall, although the short-term rebound strength is weak, the main force has a demand for a rebound, so buying at lower levels is advisable.
Short-term Reference:
Buy at 88,000 and 87,000, exit if it falls below 86,500, target above 91,000 aiming for 91,500.
Sell at 91,000 and 91,500, exit if it falls below 92,000, target below 90,500 aiming for 89,500.
Ethereum (ETH) Latest Market Analysis
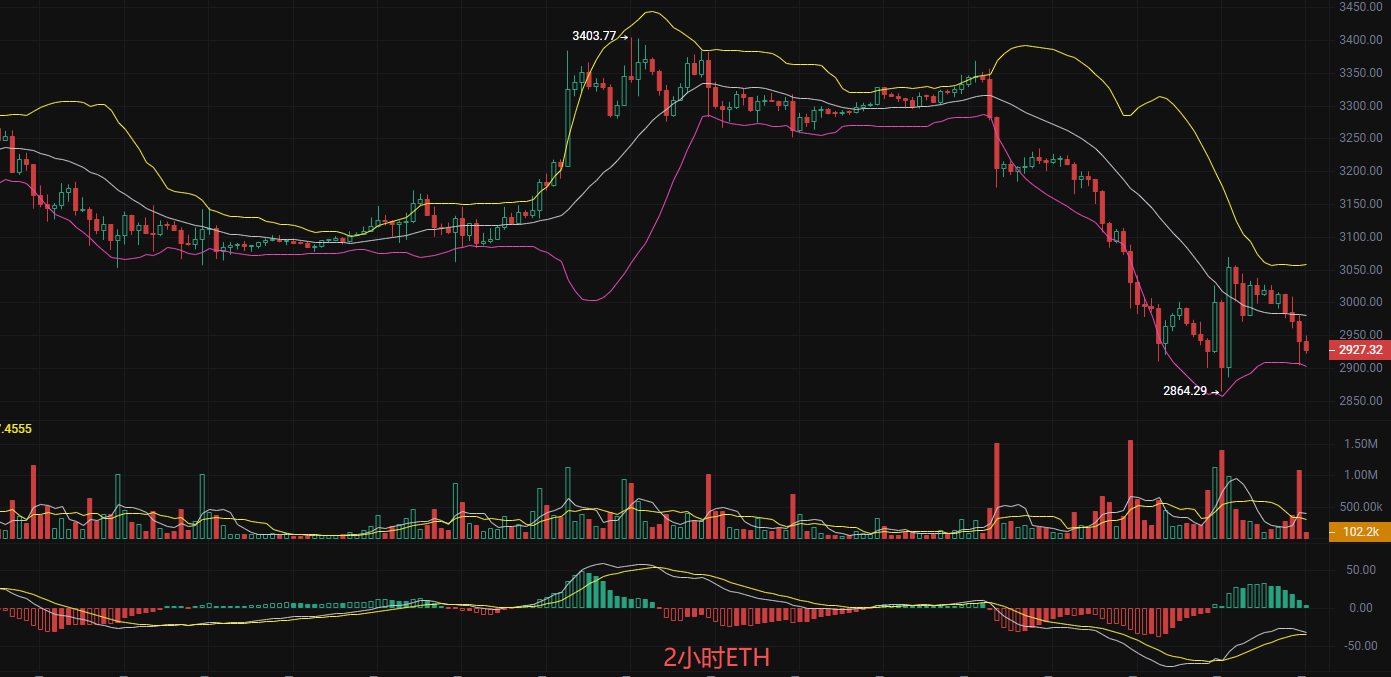
Before publication, the current price of Ethereum is 2,930. Liying's strategy yesterday was to buy at 2,900 with a target of 3,000, aiming for 3,100 remains unchanged. Currently, the 2-hour chart shows a downward trend with high points gradually decreasing and low points also declining, forming a short-term weak pattern. The daily chart has shown significant volatility with sharp rises and falls in the past two days, and is currently in a correction phase. The MACD on the 2-hour chart shows weakening bullish momentum; the daily MACD overall leans bearish. The EMA overall trend is also in a foundational stage at the bottom, with the main force frequently testing bottom support, indicating a demand for a rebound. If short-term support holds, buying is advisable.
Strategy Reference:
Buy at 2,900 and 2,950, exit if it falls below 2,820, target above 3,000 aiming for 3,100.
Sell at 3,100 and 3,150, exit if it falls below 3,180, target below 3,000 aiming for 2,950.
The above content is exclusively original by Liying, please indicate the source when reprinting! Article publication review has a delay, and the market changes rapidly; the above suggestions are for reference only and risk is borne by the reader. I hope Liying's insights will be helpful to you!

The content of the article is time-sensitive, for reference only, and risk is borne by the reader.
免责声明:本文章仅代表作者个人观点,不代表本平台的立场和观点。本文章仅供信息分享,不构成对任何人的任何投资建议。用户与作者之间的任何争议,与本平台无关。如网页中刊载的文章或图片涉及侵权,请提供相关的权利证明和身份证明发送邮件到support@aicoin.com,本平台相关工作人员将会进行核查。