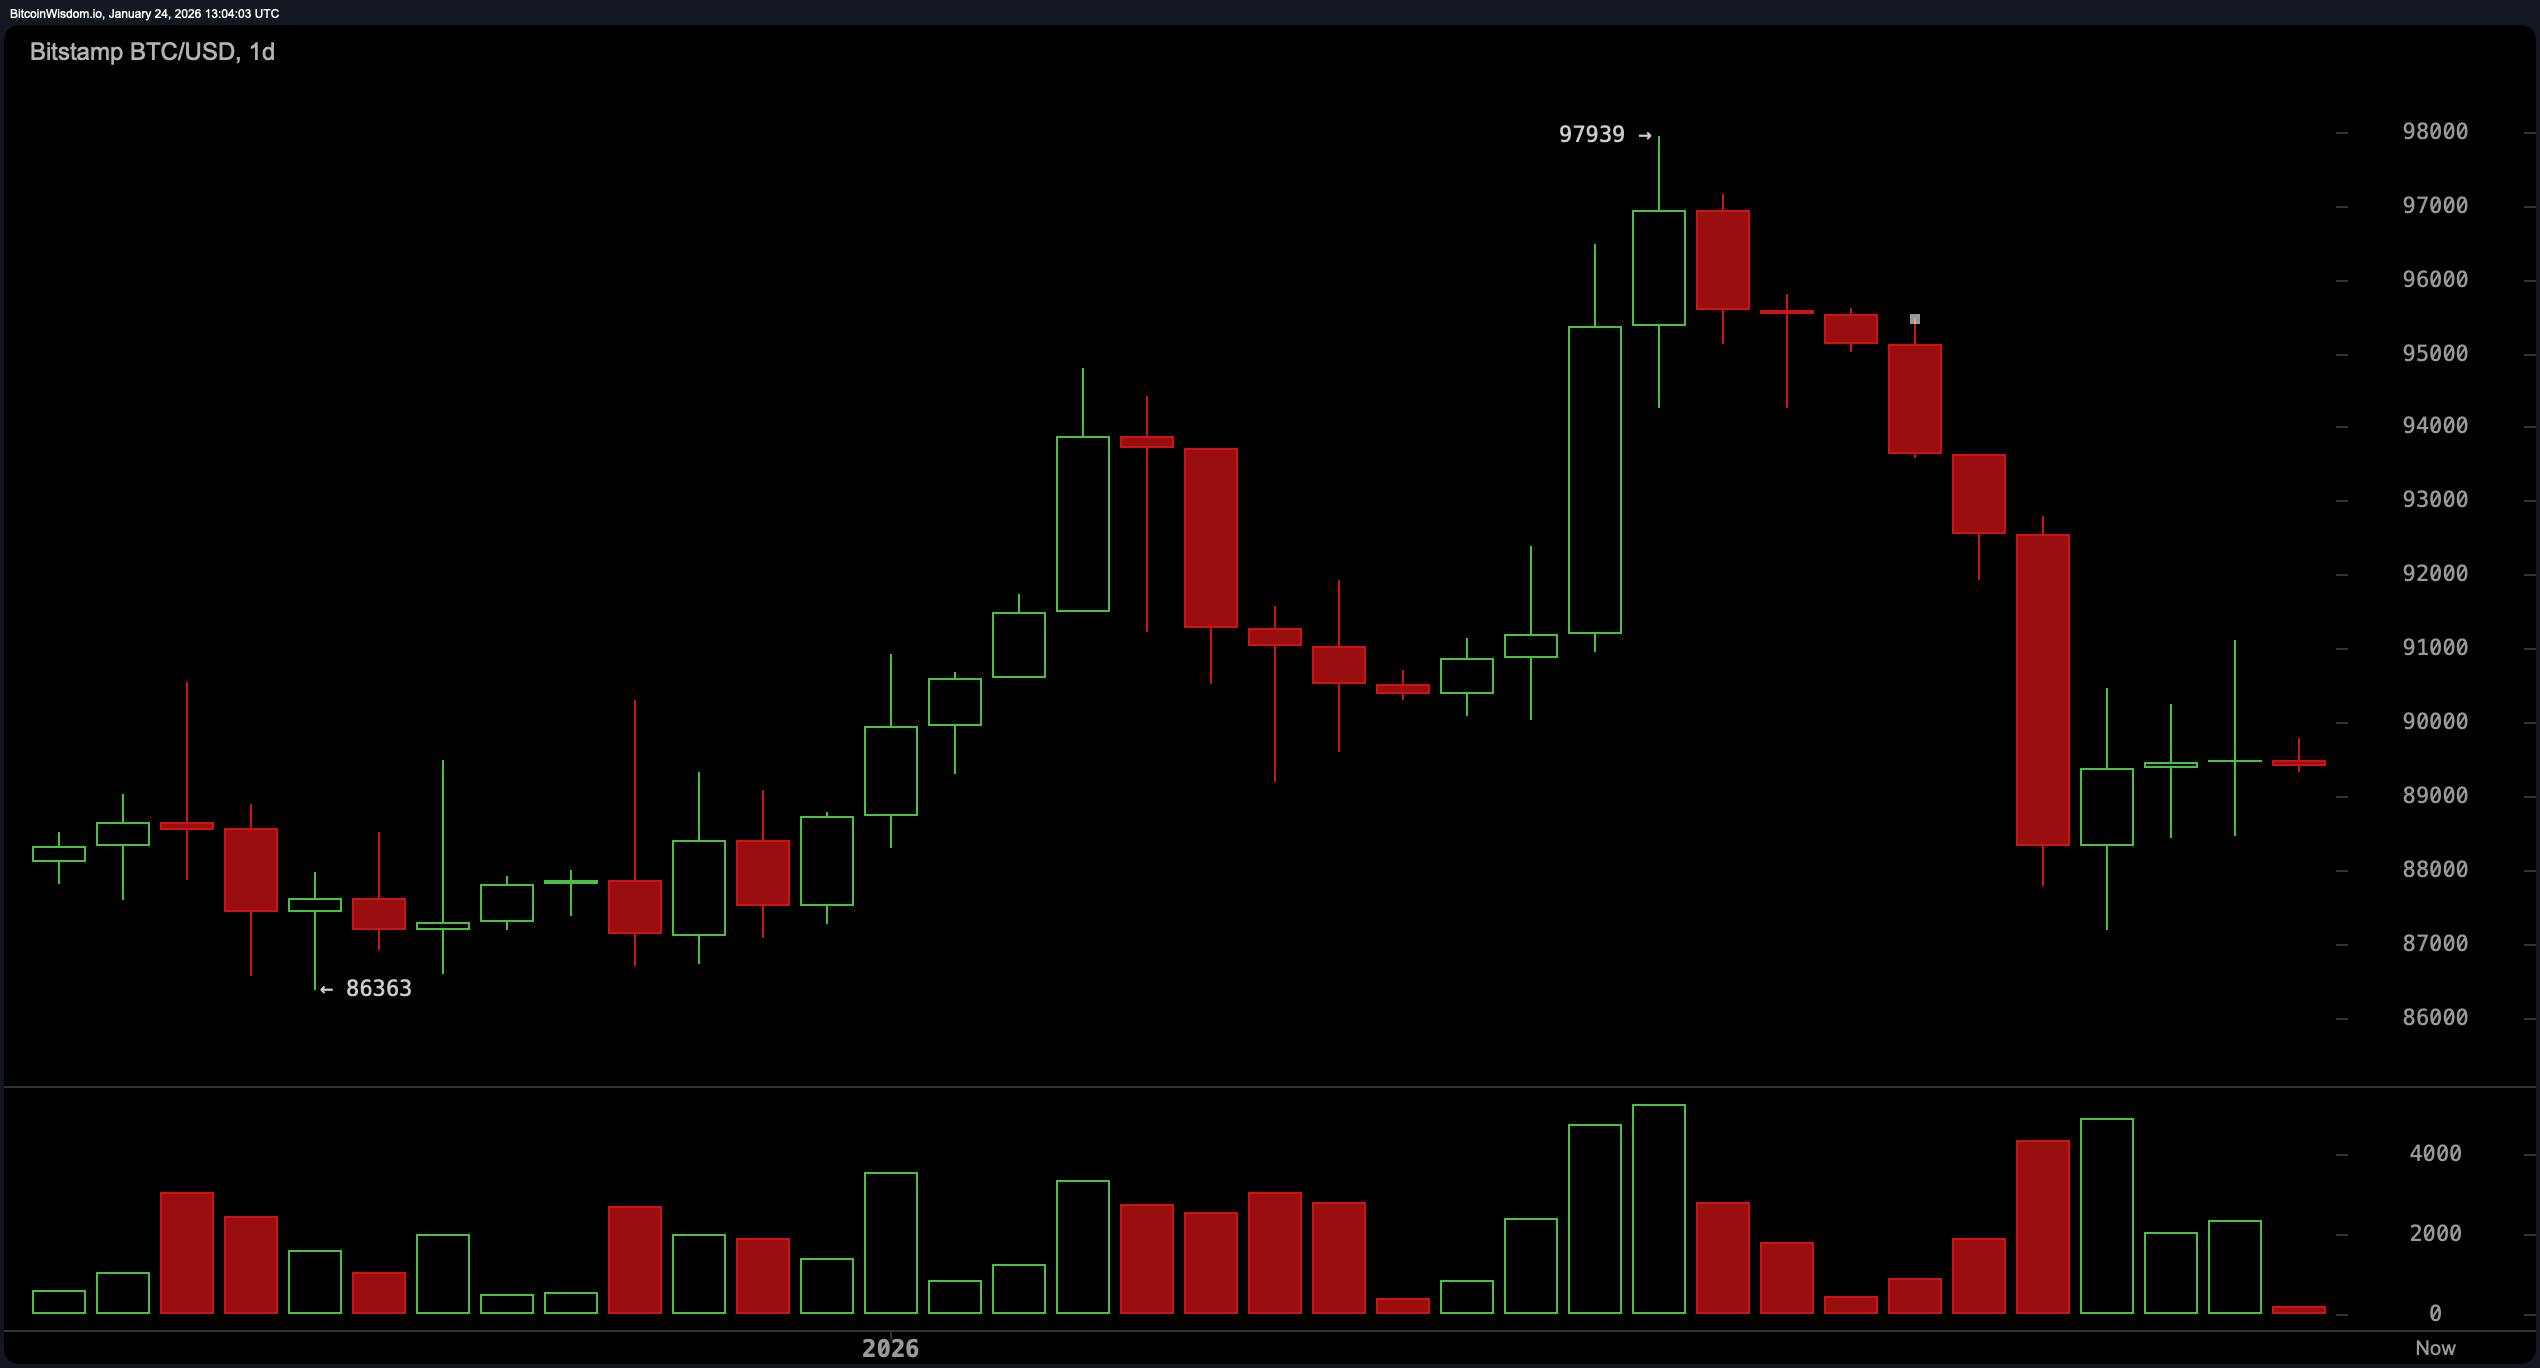
On the daily chart, bitcoin is sitting pretty in the aftermath of a not-so-pretty selloff, cascading from its recent high of nearly $98,000 to a low around $86,000. Volume told the tale—heavy outflows mirrored panic exits at a nightclub fire drill. But not all is grim; price has bounced back to the $89,000–$90,000 zone, forming what could be the early stages of a base.
Candlesticks show indecision and narrow ranges, like a crowd collectively holding its breath. Support sits between $86,000 and $88,000, and while a break above $91,000 might excite short-term optimists, the real test lies at the $94,000–$95,000 resistance ceiling.
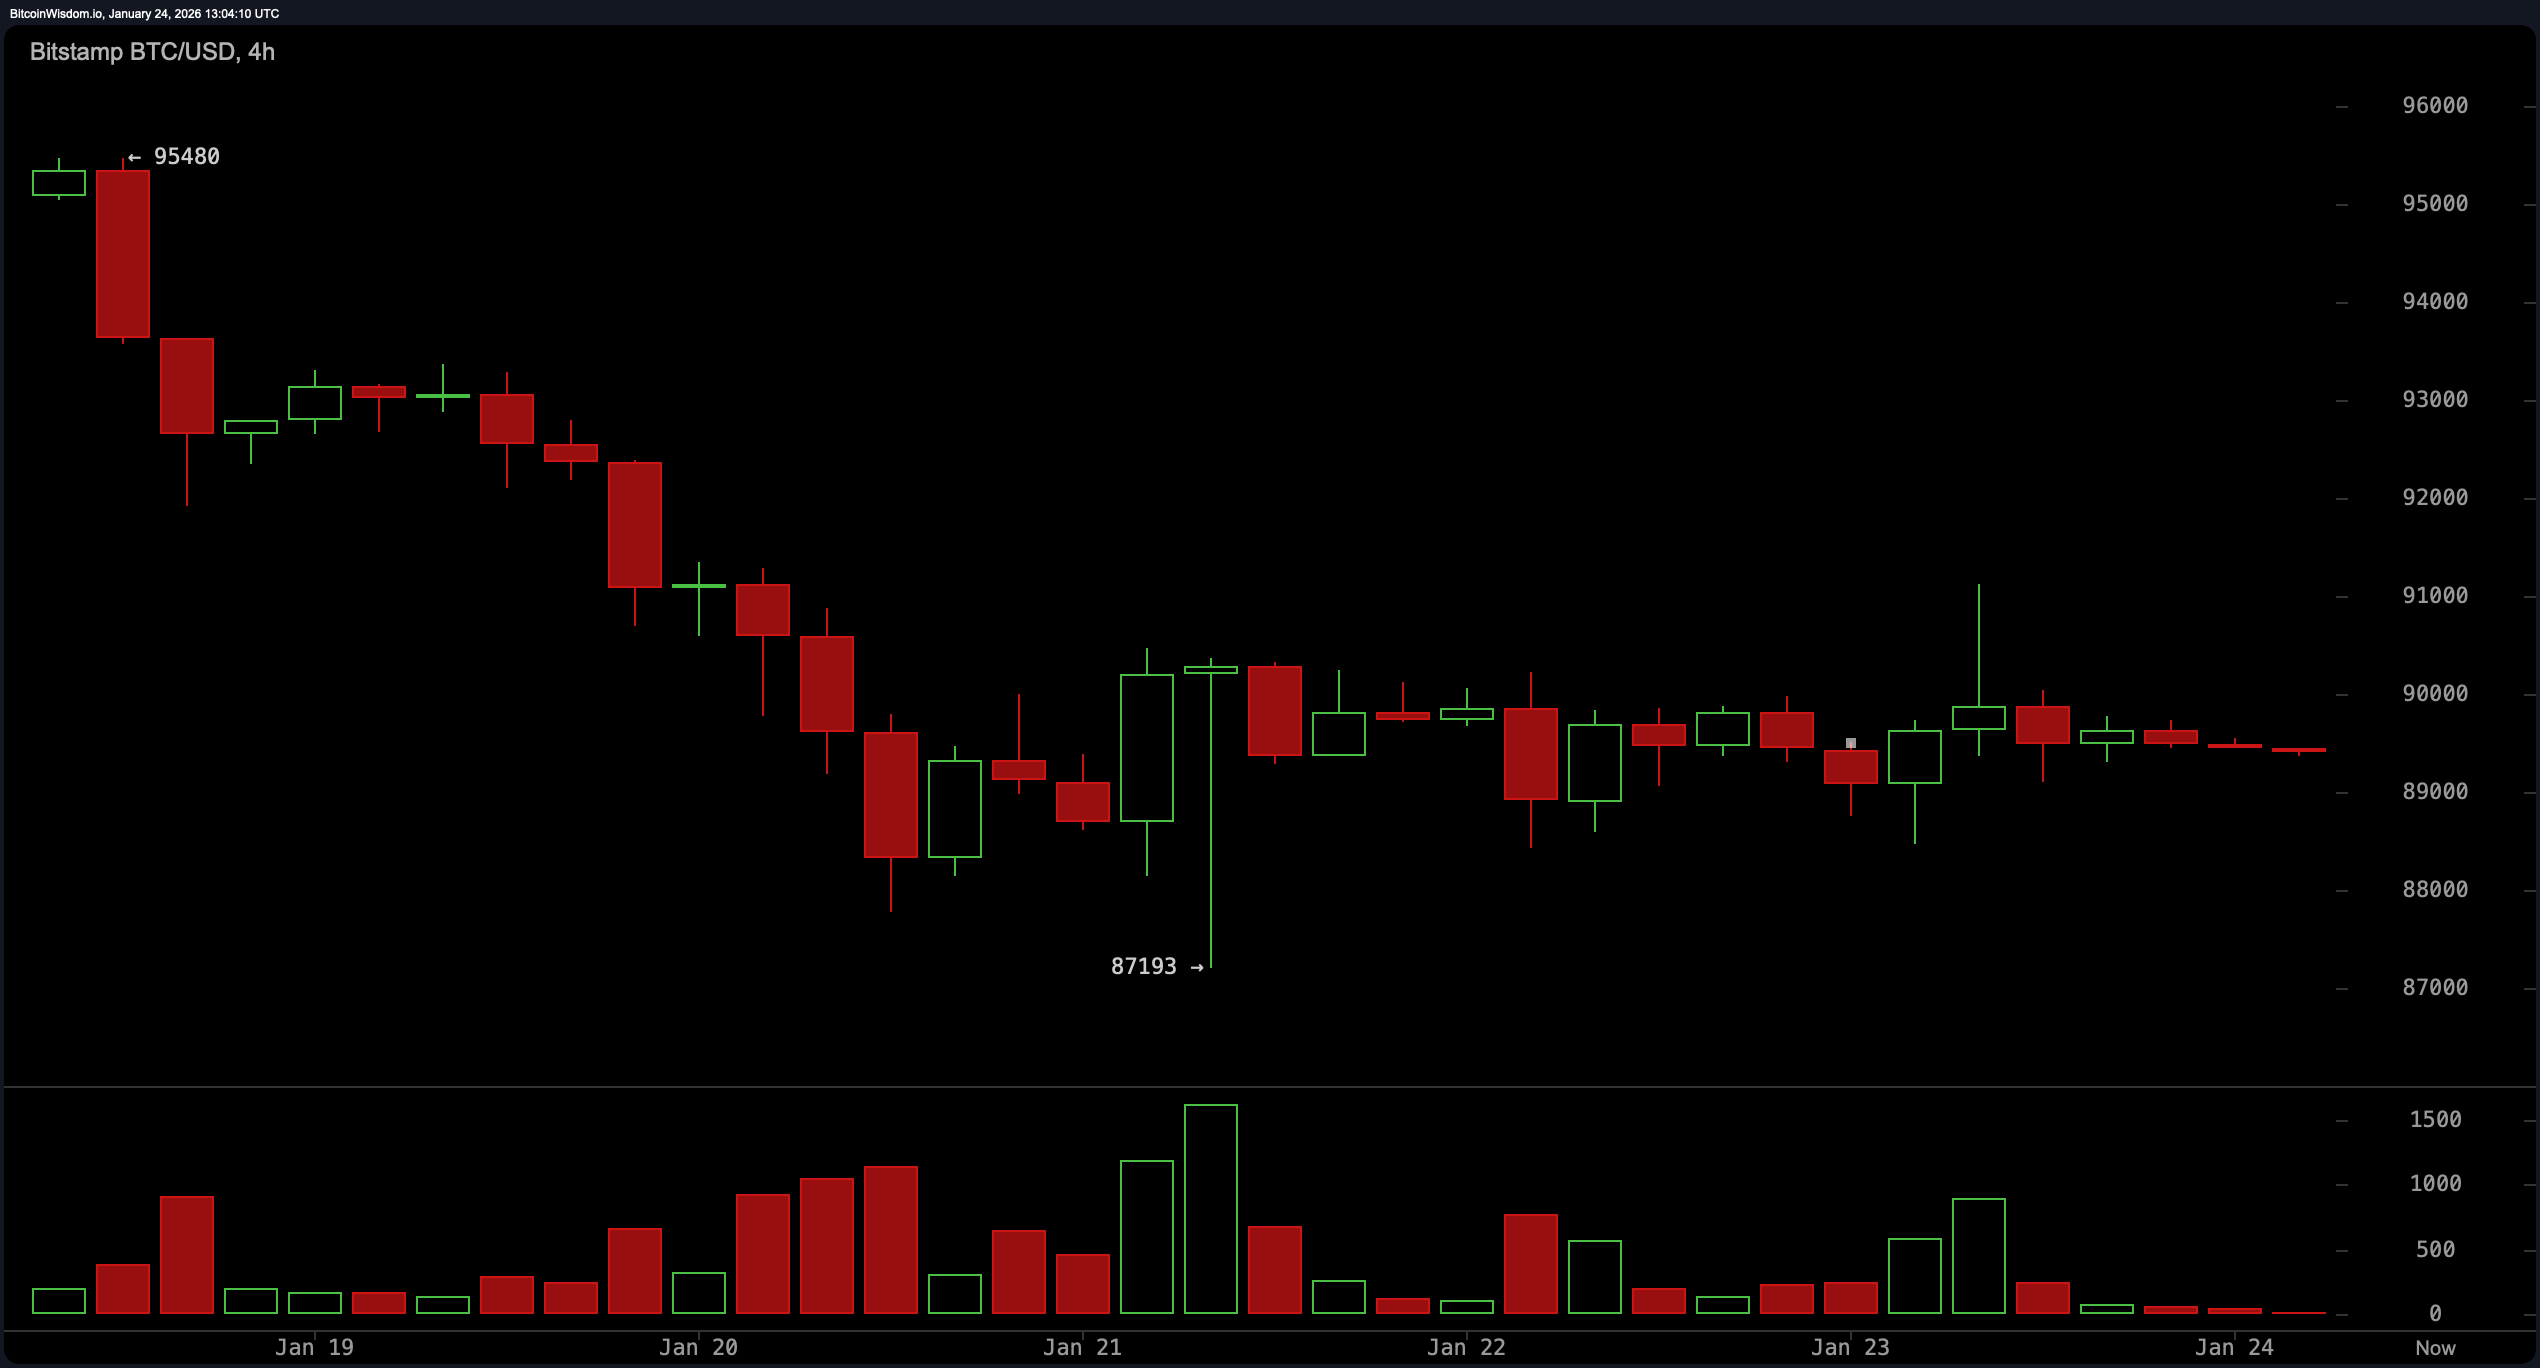
The 4-hour chart reinforces the same cautious optimism—think of it as bitcoin quietly sipping coffee, contemplating its next big move. The descent from $95,480 to $87,193 has mellowed into sideways action, trading in tight candles with subdued volume. A minor spike near January 23–24 hints at interest, but it’s far from a decisive push. The sweet spot to watch? A confirmed breakout above $90,500 could nudge the door open to a short-term uptrend. But without volume stepping up to the mic, any breakout attempt might fall flat.
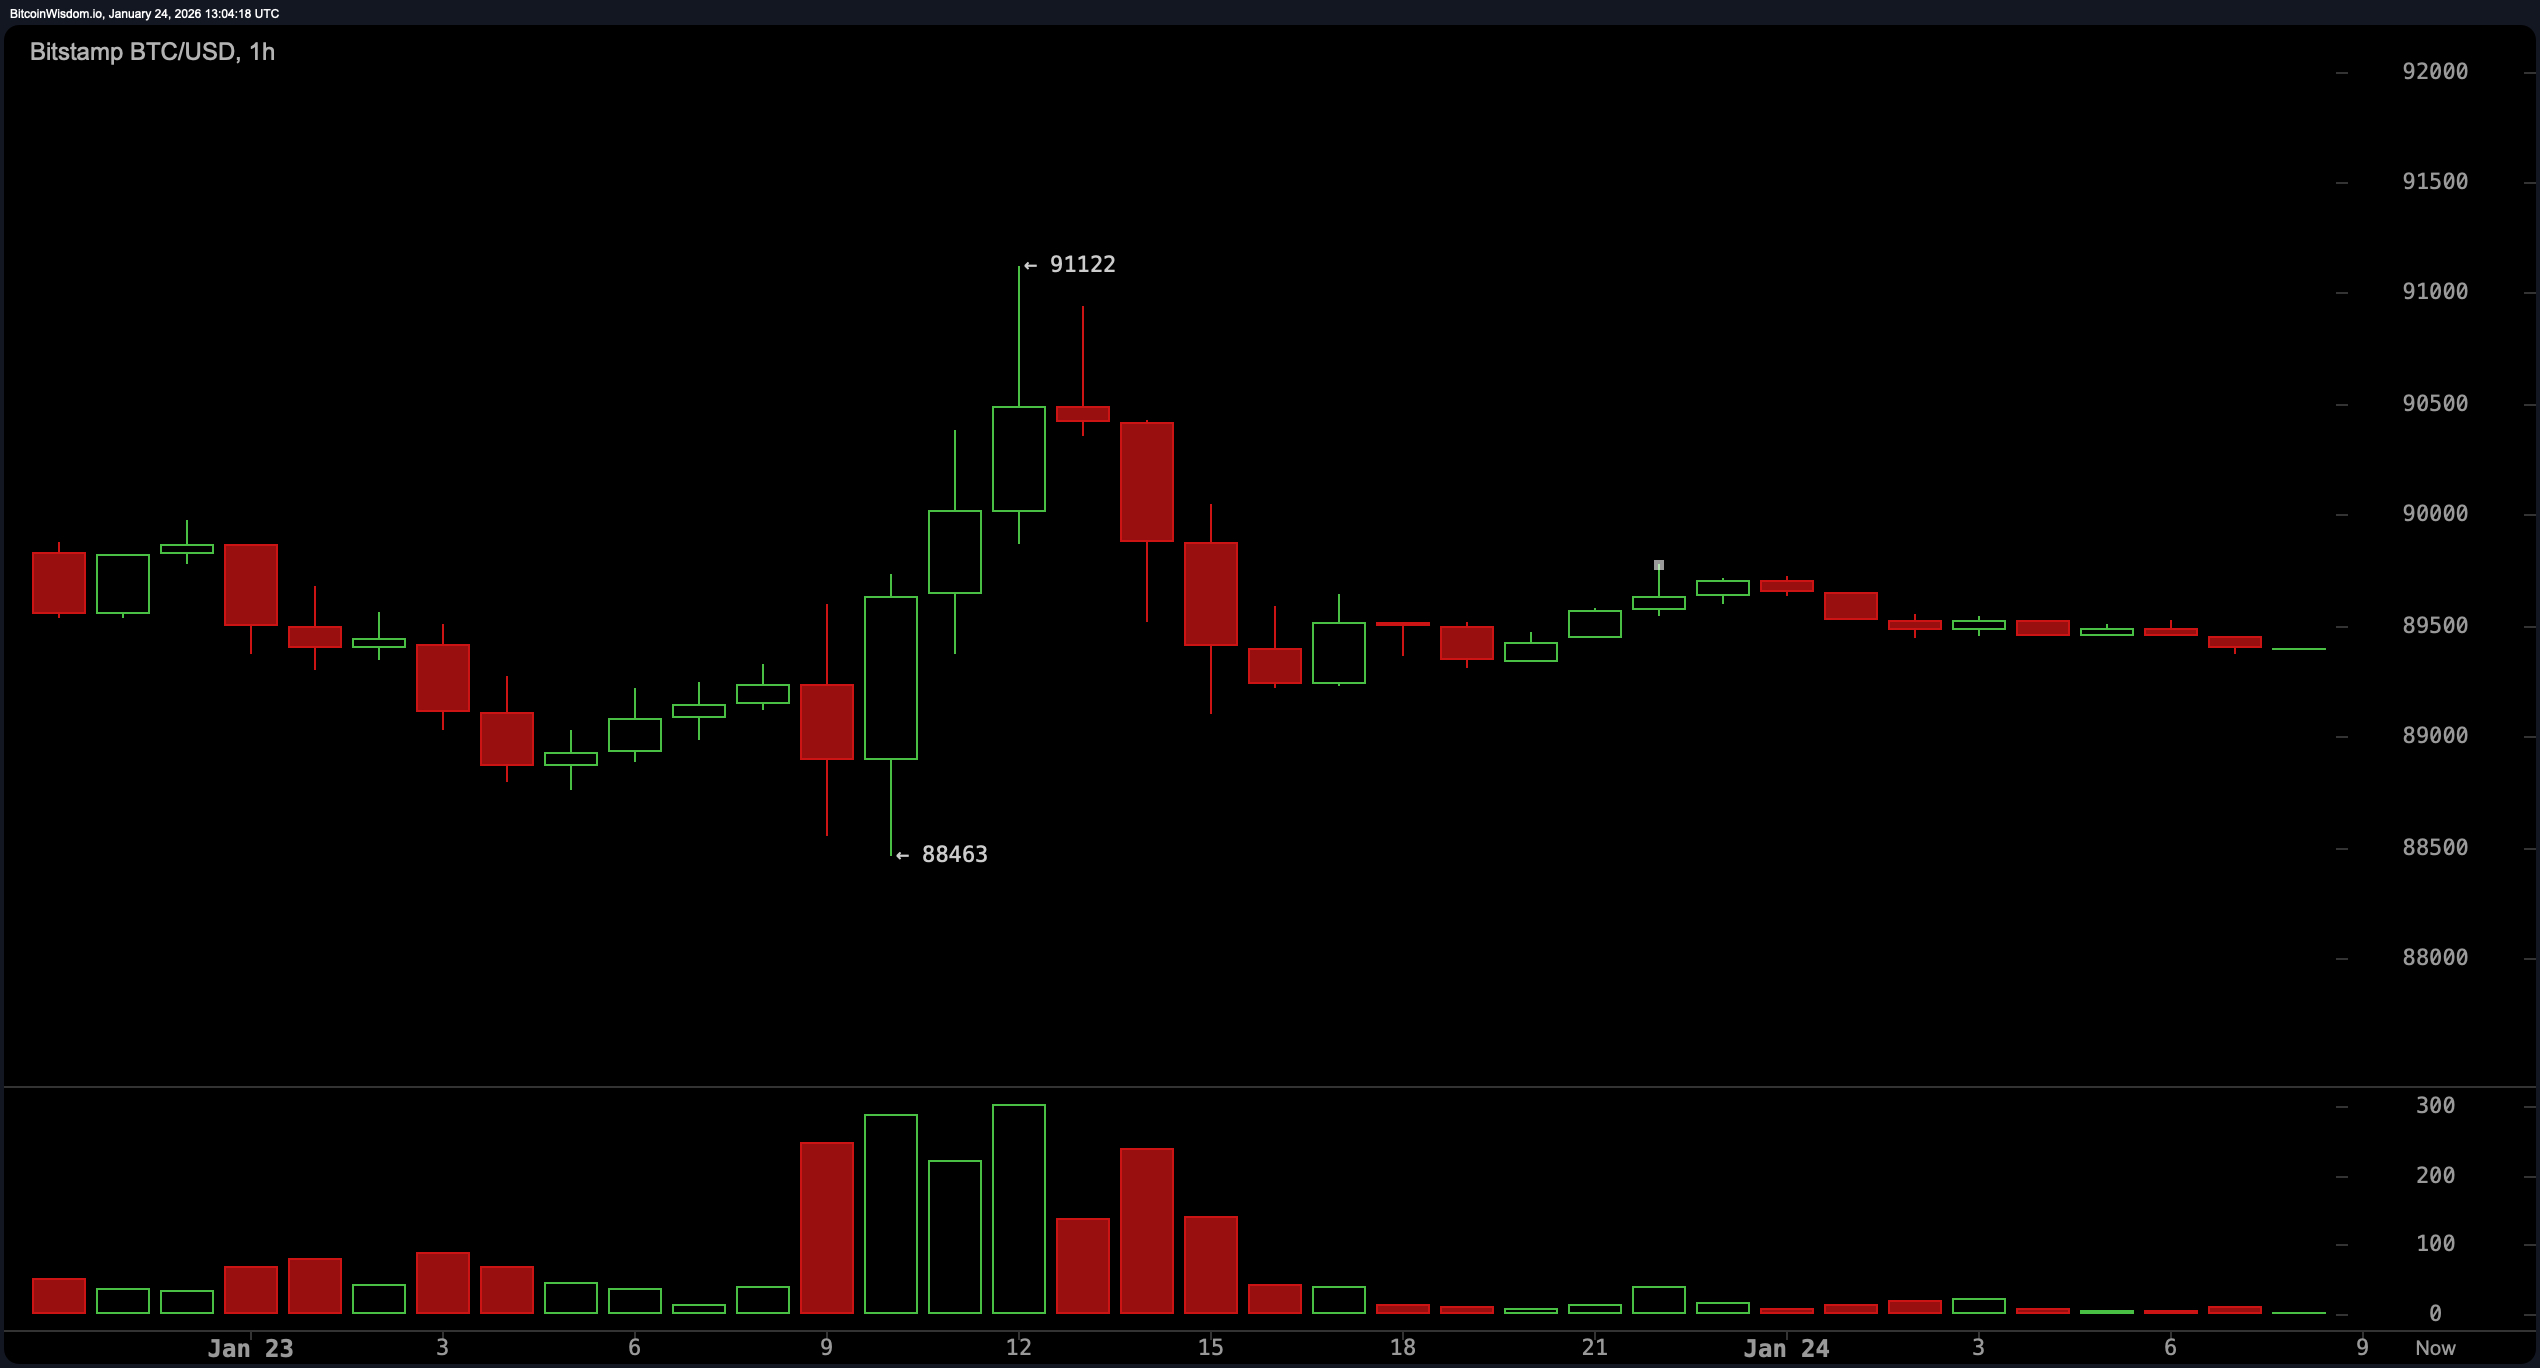
Zooming into the 1-hour chart, bitcoin’s behavior takes on a twitchier personality, like a squirrel darting between $88,500 and $91,000. The pattern of higher lows suggests a micro uptrend is underway, though the latest rejection at $91,122 casts doubt on momentum. Volume continues to fizzle, indicating the market’s appetite for risk is on a diet. A clean break over $91,000 with some punch from volume could spark a quick move toward the $91,500–$92,000 zone. Until then, short-term traders might keep a close eye on dips to $88,500 for possible entries, assuming support doesn’t ghost them.
Oscillators are playing the role of diplomatic bystanders. The relative strength index ( RSI) is neutral at 43, offering no strong clues. The stochastic oscillator is chilling at 21, also neutral, while the commodity channel index (CCI) hangs in the neutral territory at -84. However, some moodiness surfaces in the momentum indicator, printing a value of -7,546, and the moving average convergence divergence ( MACD) level isn’t exactly cheerful at -146—both leaning bearish. In short, indicators are cautious, like a cat sniffing a new piece of furniture.
Moving averages are sending their RSVP to the bear party—all pointing south. Every key exponential moving average (EMA) and simple moving average (SMA) from the 10-period to the 200-period are camped out above the current price, each one signaling pressure. The 10-period EMA sits at 90,867, while the 200-period SMA towers at 105,248—miles above bitcoin’s current position. With this full-on traffic jam of resistance, the asset has some convincing to do before any upward move sticks. Until the price claws its way above these averages, upward momentum remains a speculative whisper.
In sum, bitcoin is leaning on a support zone while its indicators hedge their bets. The charts tell a tale of a market pausing at a crossroads—momentum is fading, yet a breakout remains within the realm of possibility. Patience is more than a virtue here—it’s a strategy.
Bull Verdict:
If bitcoin can muster the strength to break above $91,000 with convincing volume, a short-term recovery toward $94,000–$95,000 isn’t off the table. Oscillators may be neutral, but price structure hints at a potential rebound from support. Momentum remains cautious, but bulls could find their footing if resistance levels begin to fold.
Bear Verdict:
With all key moving averages stacked above the current price and momentum indicators flashing red, the path of least resistance remains downward. Fading volume and failed breakouts reinforce market hesitation. Unless bitcoin breaks through overhead resistance with conviction, bears remain firmly in control of the stage.
- What is bitcoin’s price today?
Bitcoin is trading at $89,396 as of January 24, 2026. - What’s the current support level for bitcoin?
Key support lies between $86,000 and $88,000. - Where is bitcoin facing resistance?
Major resistance zones are $91,000 and $94,000–$95,000. - Is bitcoin trending up or down right now?
Charts show a weak bounce with bearish pressure from moving averages.
免责声明:本文章仅代表作者个人观点,不代表本平台的立场和观点。本文章仅供信息分享,不构成对任何人的任何投资建议。用户与作者之间的任何争议,与本平台无关。如网页中刊载的文章或图片涉及侵权,请提供相关的权利证明和身份证明发送邮件到support@aicoin.com,本平台相关工作人员将会进行核查。


