Odaily invited market analyst Cody, a master's degree holder in financial statistics from Columbia University in the United States, who has focused on quantitative trading in the U.S. stock market since college and gradually expanded to digital assets such as Bitcoin. He has built a systematic quantitative trading model and risk control system in practice; he possesses keen data insights into market fluctuations and is committed to continuous deepening in the professional trading field, pursuing stable returns. He will delve into changes in BTC technology, macroeconomics, and capital flow weekly, reviewing and showcasing practical strategies, and previewing significant recent events for reference.

Core Summary of the Weekly Trading Report:
In the previous article, we compared the BTC trend structures of 2021 and 2025, judging that history might repeat itself (BTC will continue to decline), which received a lot of feedback, and some analysts had differing opinions. Below, based on this week's updates, we will conduct a detailed analysis of the current market trend characteristics and future focal points. Everyone is welcome to discuss.
• Strategy Execution (Short-term) Effect Verification: Last week's trading strictly followed the established strategy, completing a short-term operation (1x leverage) and successfully achieving a return of 3.76%. (Details can be found in Figure 1)
• Core Viewpoint (Short-term) Verification: At the beginning of last week, the price quickly broke below the core range of $94,500 to $95,000, returning to the original fluctuation range of $84,000 to $94,500, and continued to move towards the lower boundary of the range. It is particularly emphasized that the lowest point of the price last week coincided exactly with the support level of $86,000 that we previously pointed out. Overall, the market trend and the performance of key support levels last week were accurately validated by the market.
The following will review the market prediction, strategy execution, and specific trading process in detail.
I. Learning from History, We Need to View the Current Market Dialectically (See Figure 3)
By comparing the weekly adjustments of BTC after its two historical peaks, we observed a strikingly similar structural pattern between the adjustment starting in October 2025 and the one in November 2021. Currently, the market is at a critical technical decision point.
- Key Technical Position: Gains and Losses of the Lower Boundary of the Ascending Channel
The rebound that started from the low of $80,600 on November 21, 2025, has formed a clear ascending channel. The lower boundary of this channel has become the "lifeline" determining the short-term trend.
- Two Possible Paths for Bitcoin's Future Trend:
• If it regains stability at the lower boundary of the channel, the B wave rebound is expected to continue. The next step will first test the pressure around $94,500, followed by a challenge to the 21-week moving average, which is a key resistance level. The realization of this path requires macroeconomic support, especially a shift in the Federal Reserve's policy expectations towards easing.
• If it effectively breaks below the lower boundary of the channel and the model momentum line (daily) breaks below the zero axis, it will declare a return to a bearish market at the daily level. This means that the B wave rebound that started on November 21, 2025, may have ended, and the C wave adjustment will continue further, significantly increasing the possibility of the price breaking below $80,600.
- Three-Stage Adjustment Structure Analysis: Based on the premise of the price effectively breaking below the lower boundary of the channel
The current adjustment that started in October 2025 presents a typical three-stage structure:
• A wave adjustment: From $126,200 (2025-10-06) to $80,600 (2025-11-21), lasting 46 days, with a decline of 36%.
• B wave rebound: From $80,600 (2025-11-21) to $97,924 (2026-01-14), lasting 54 days, with an increase of 21.5%, this stage belongs to technical repair.
• C wave adjustment: From $97,924 (January 14) to the present. Currently, we are in this stage, and the gains and losses of the lower boundary of the channel will become the key basis for judging the intensity of the C wave adjustment.
- C Wave Adjustment Target Prediction:
• $80,600, this is the starting point of the B wave. If it effectively breaks below this point, the A-B-C three-wave adjustment structure that started from $126,200 will tend to be complete.
• $75,200, this price level is both the 50% Fibonacci retracement of the A wave decline and coincides with the adjustment low of April 2025, forming an important historical support area.
"History will repeat itself, but it will not simply repeat" is the most profound dialectic in financial markets. It requires investors to respect historical laws while also discerning the particularities of the current market. Therefore, all rational market predictions are probabilistic outlooks derived from a comprehensive analysis of fundamentals and technical structures, rather than deterministic prophecies. The ultimate goal is not to predict the future accurately but to formulate more resilient response strategies.
II. Bitcoin Market Review Last Week (01.19~01.25)
- Review of Last Week's Short-term Operations: As shown in (Figure 1)
① Summary of Trading Details (No Leverage Added)
We strictly followed the trading signals issued by our self-constructed spread trading model and momentum quantitative model, combined with our market trend predictions, to complete a short-term operation, achieving a profit of 3.76%.
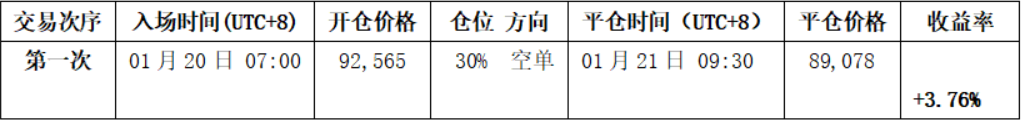
Specific trading details and review are as follows:
Bitcoin 30-minute K-line chart: (Momentum Quantitative model + Spread Trading model)
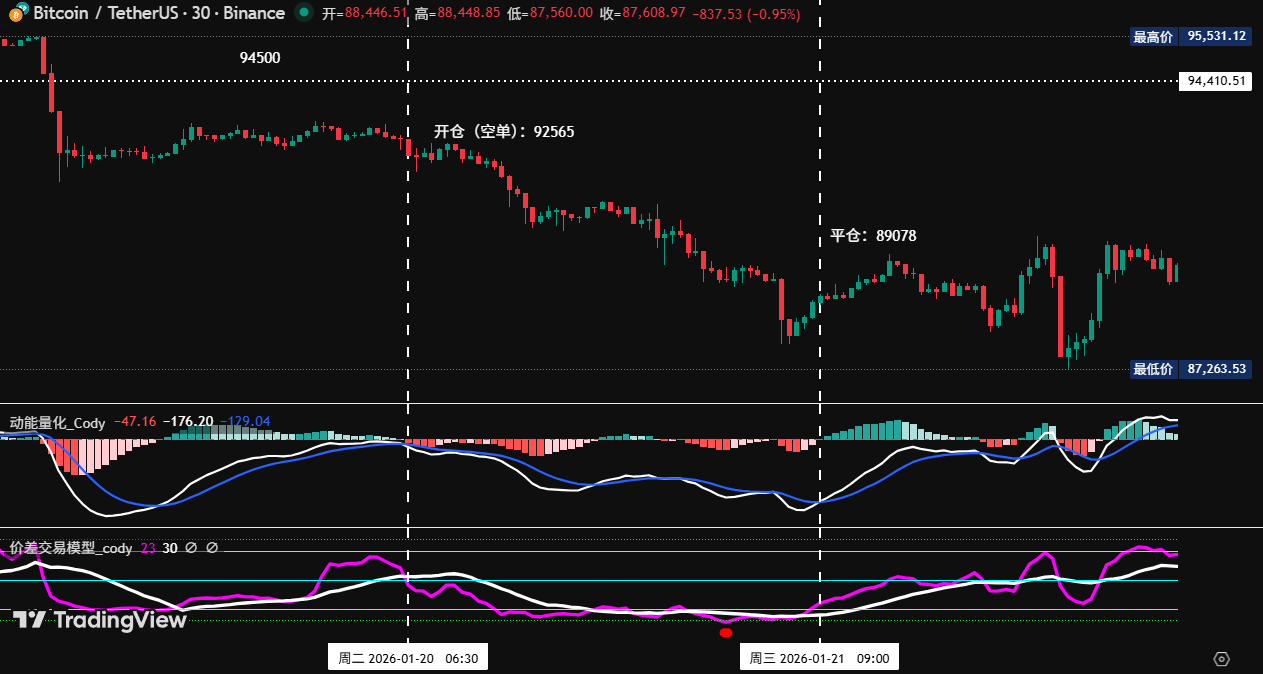
Figure 1
② Short-term Trading Review:
• First Trade (Profit 3.76%): This operation executed Plan B (shorting on effective break below the key area) strategy: When the price broke below the $94,500 to $95,000 area and the rebound was weak, the spread trading model and momentum model resonated to trigger a top signal, combined with two momentum lines forming a death cross below the zero axis, creating a triple bearish signal. Based on this, we established a 30% short position at $92,565, and the market trend adjusted as expected. When the price fell to an important support level, the spread model first issued a bottom warning signal (red dot), and then the momentum quantitative model and spread trading model resonated again to generate a bottom signal. Based on this, we closed all positions at $89,078, achieving the expected profit target.
- Review of Last Week's Trend Prediction and Operation Strategy:
① Last week, we clearly indicated: Focus on the gains and losses of the $94,500 to $95,000 area. **If it effectively breaks below, it will maintain a fluctuation in the *$84,000 to $94,500* range.**
② Review of Core Points: The resistance level is at the $94,500 to $95,000 area; the first support level is at the $89,500 to $91,000 area, and the second support level is at the $86,000 to $86,500 area.
② Review of Operation Strategy:
• Medium-term Strategy: No positions.
• Short-term Strategy: Since the price effectively broke below the $94,500 to $95,000 area, execute operations according to Plan B (see below):
• Opening Position: If it rebounds to this area and confirms an effective break, a 30% short position can be established.
• Risk Control: The initial stop loss for the short position is set above the cost price at about 1.5% (i.e., 1.015 * cost price).
• Closing Position: When it dips to around $86,500 and combines with model signals, positions can be gradually closed for profit.
III. Bitcoin Trend Structure: Daily Level Maintains Bearish Pattern
Combining market operations, the author conducts an in-depth analysis of Bitcoin's trend structure based on the self-constructed trading system from multiple models and dimensions.
Bitcoin Weekly K-line chart: (Momentum Quantitative Model + Sentiment Quantitative Model)
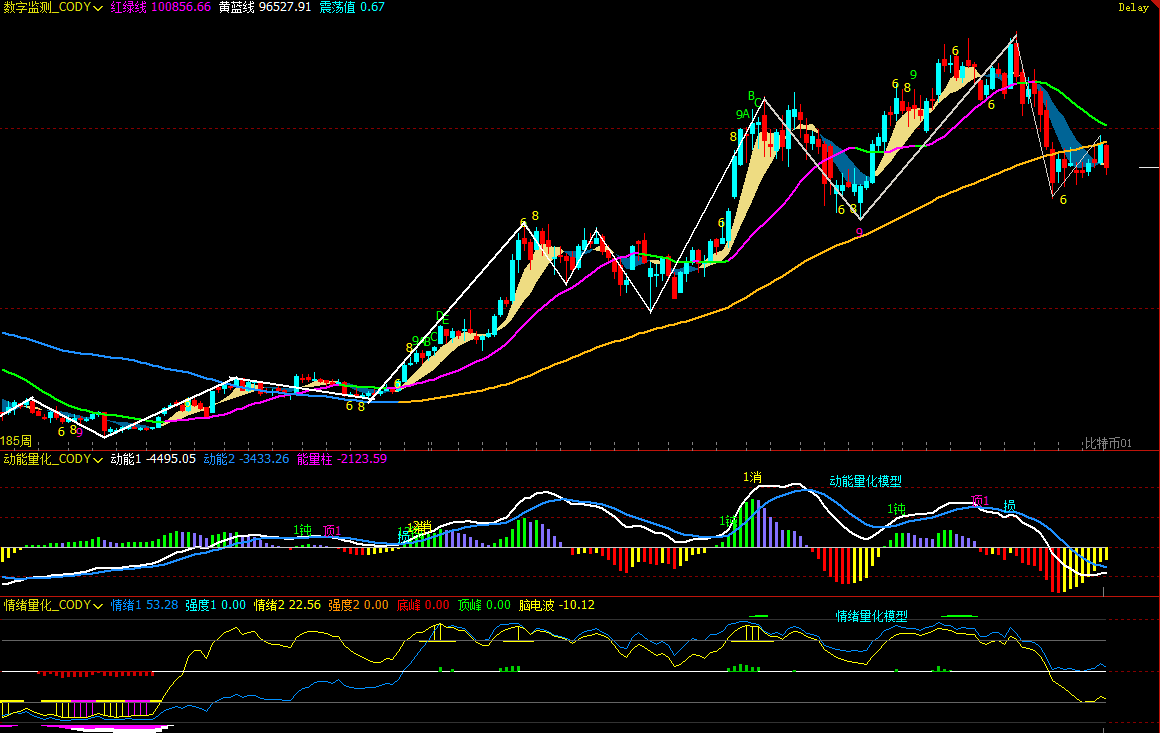
Figure 2
- As shown in (Figure 2), from the weekly chart analysis:
• Momentum Quantitative Model: Technical indicators show that last week, short-selling momentum was somewhat released, and the two momentum lines showed signs of opening, with no significant change in the negative energy column, focusing on the performance of bears next.
The momentum quantitative model indicates: Price decline index: High
• Sentiment Quantitative Model: The blue sentiment line value is 53.28, with an intensity of zero; the yellow sentiment line value is 22.56, with an intensity of zero, and the peak value is 0.
The sentiment quantitative model indicates: Price pressure and support index: Neutral
• Digital Monitoring Model: The price has been below the long-short (yellow-blue line) boundary for 10 weeks, and the price has fallen again, moving far from the boundary.
The digital monitoring model indicates: Monitoring (top-bottom) digital signals have not appeared; the weekly K-line closed with a large bearish line, with a decline of about 7.55%; the last three weekly K-lines formed a "strong top distribution" bearish pattern.
The above data indicates: Bitcoin's weekly bearish trend, beware of the risk of oscillating declines.
Bitcoin Daily K-line chart: (Momentum Quantitative Model + Sentiment Quantitative Model)
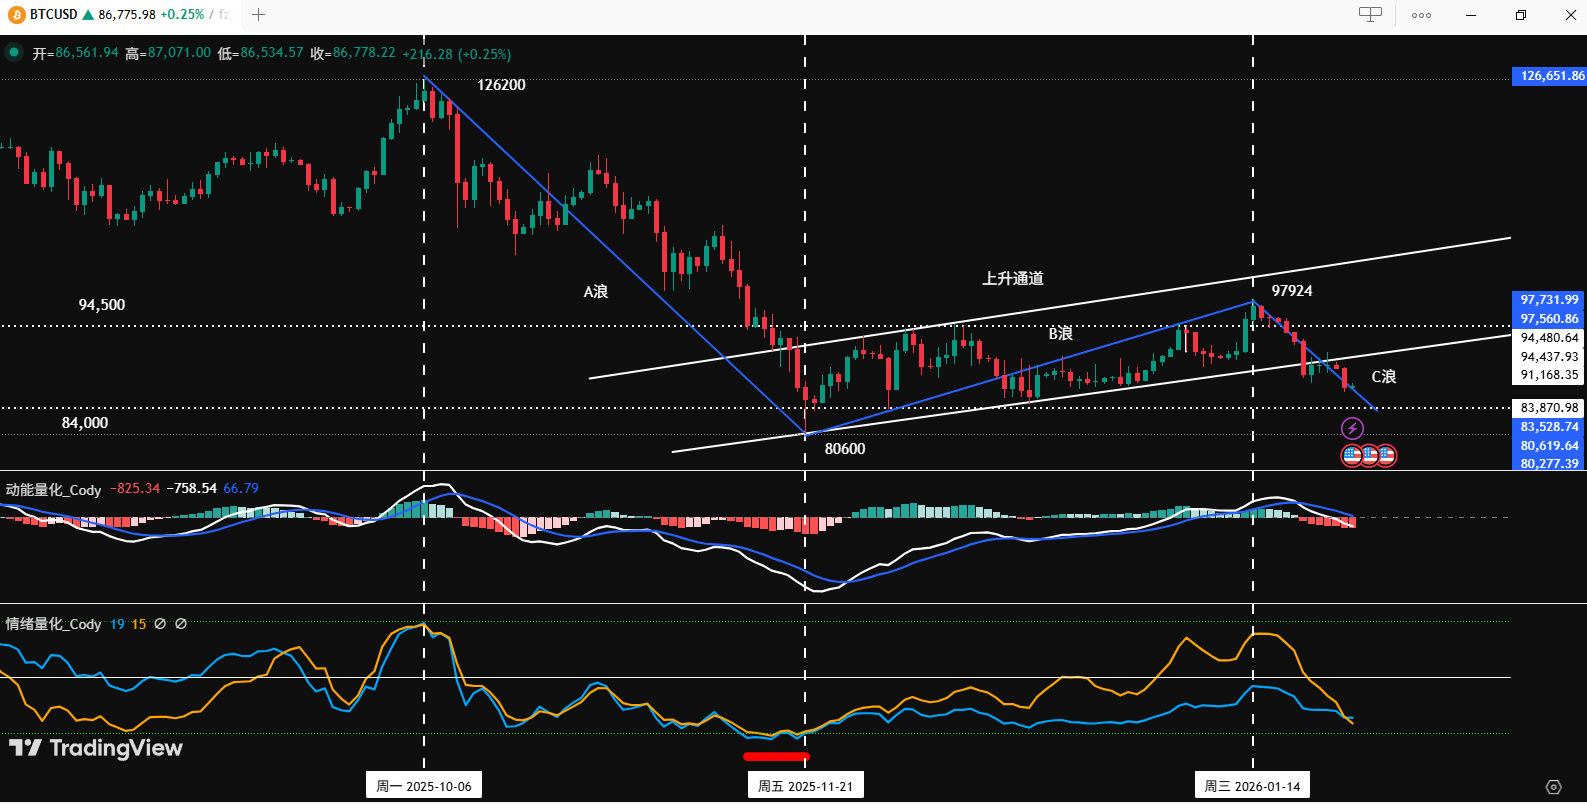
Figure 3
- As shown in (Figure 3), from the daily chart analysis:
• Momentum Quantitative Model: Last week overall presented a "decline-oscillation-decline" pattern. After Sunday’s trading, the first momentum line has crossed below the zero axis, and the second line is about to cross below the zero axis; the negative energy column is gradually expanding.
The momentum quantitative model indicates: Daily short-selling momentum is released, focus on gains and losses at the zero axis.
• Sentiment Quantitative Model: After last week's Sunday close, the blue sentiment line value is 19, with an intensity of zero; the yellow sentiment line value is 20, with an intensity of zero.
The sentiment quantitative model indicates: Pressure and support index: Neutral
The above data suggests: The daily level initially shows a bearish pattern, and its effectiveness still needs confirmation, focusing on the competition between bulls and bears at the zero axis.
IV. Market Prediction for This Week (01.26~02.01)
- Core Viewpoint for This Week: Focus on the effective confirmation after breaking below the lower boundary of the ascending channel.**
• If the price effectively breaks below the lower boundary, it will accelerate the adjustment, with the first target looking at the original fluctuation box's lower edge around $84,000.
• If the price effectively stabilizes, it will maintain oscillation within the ascending channel, but the height will be limited.
- Core Resistance Level:
• First resistance area: $88,500 to $91,200 (previous fluctuation center)
• Second resistance area: $94,500 to $95,000 (previous fluctuation center)
• Important resistance area: Near the 21-week moving average
- Core Support Levels:
• First support level: $86,000 to $86,500 (previous area of concentrated trading)
• Second support level: Near $84,000 (previous box's lower edge)
• Important support level: Near $80,000 to $80,600 (near last November's low)
V. Operating Strategy for This Week (Excluding Impact from Sudden News): (01.26~02.01)
Medium-term Strategy: If it effectively breaks below the lower boundary of the ascending channel, consider establishing a 60% short position.
Short-term Strategy: Use a 30% position, set stop-loss points, and look for "spread" opportunities based on support and resistance levels. (Using 30 minutes as the operating cycle).
In operations, focus on the gains and losses of the lower boundary of the ascending channel. To dynamically respond to market changes and combine with real-time model signals, we propose two short-term operation plans, A/B:
• Plan A: If the price breaks below the lower boundary of the ascending channel:
• Opening Position: After an effective break and in conjunction with model top signals, a 30% short position can be established.
• Risk Control: The initial stop loss for the short position is set above the cost price at about 1.5% (i.e., 1.015 * cost price).
• Closing Position: When it falls near important support levels and in conjunction with model signals, positions can be gradually closed for profit.
• Plan B: If the price regains stability at the lower boundary of the ascending channel: (Short on resistance)
• Opening Position: When a rebound reaches important resistance levels or the upper boundary of the channel and encounters resistance signals, in conjunction with model top signals, a 30% short position can be established.
• Risk Control: The initial stop loss for the short position is set above the cost price at about 1.5% (i.e., 1.015 * cost price).
• Closing Position: When it falls to the lower boundary of the channel or support levels, and in conjunction with model signals, positions can be gradually closed for profit.
VI. Special Reminders:
When opening a position: Immediately set the initial stop loss level.
When profit reaches 1%: Move the stop loss to the opening cost price (break-even point) to ensure capital safety.
When profit reaches 2%: Move the stop loss to the position of 1% profit.
Continuous Tracking: After that, for every additional 1% profit in price, the stop loss level will move up by 1% to dynamically protect and lock in profits.
免责声明:本文章仅代表作者个人观点,不代表本平台的立场和观点。本文章仅供信息分享,不构成对任何人的任何投资建议。用户与作者之间的任何争议,与本平台无关。如网页中刊载的文章或图片涉及侵权,请提供相关的权利证明和身份证明发送邮件到support@aicoin.com,本平台相关工作人员将会进行核查。