Qinglan Crypto Class is now open! BTC's four cycles + dual perspectives on news, guiding you to step in sync with the crypto market rhythm.
- Short-term trend: 15-minute & 1-hour candlestick analysis
The 15-minute candlestick chart shows that Bitcoin's price has experienced significant fluctuations recently. From last night until now, the price has oscillated around $87,800, then there was a strong surge, reaching around $88,800, but quickly fell back to $87,400, followed by another strong rebound, currently hovering around $88,800. In terms of technical indicators, the short-term MA moving averages (MA5, MA10, MA20) are currently showing a good bullish arrangement, meaning the short-term moving averages are above the long-term moving averages, indicating that the price is moving upward in the short term. The MACD indicator has just given a golden cross signal, with the red bars continuously increasing, and the RSI has rebounded from the previous oversold area, currently around 60, indicating strong short-term bullish momentum.
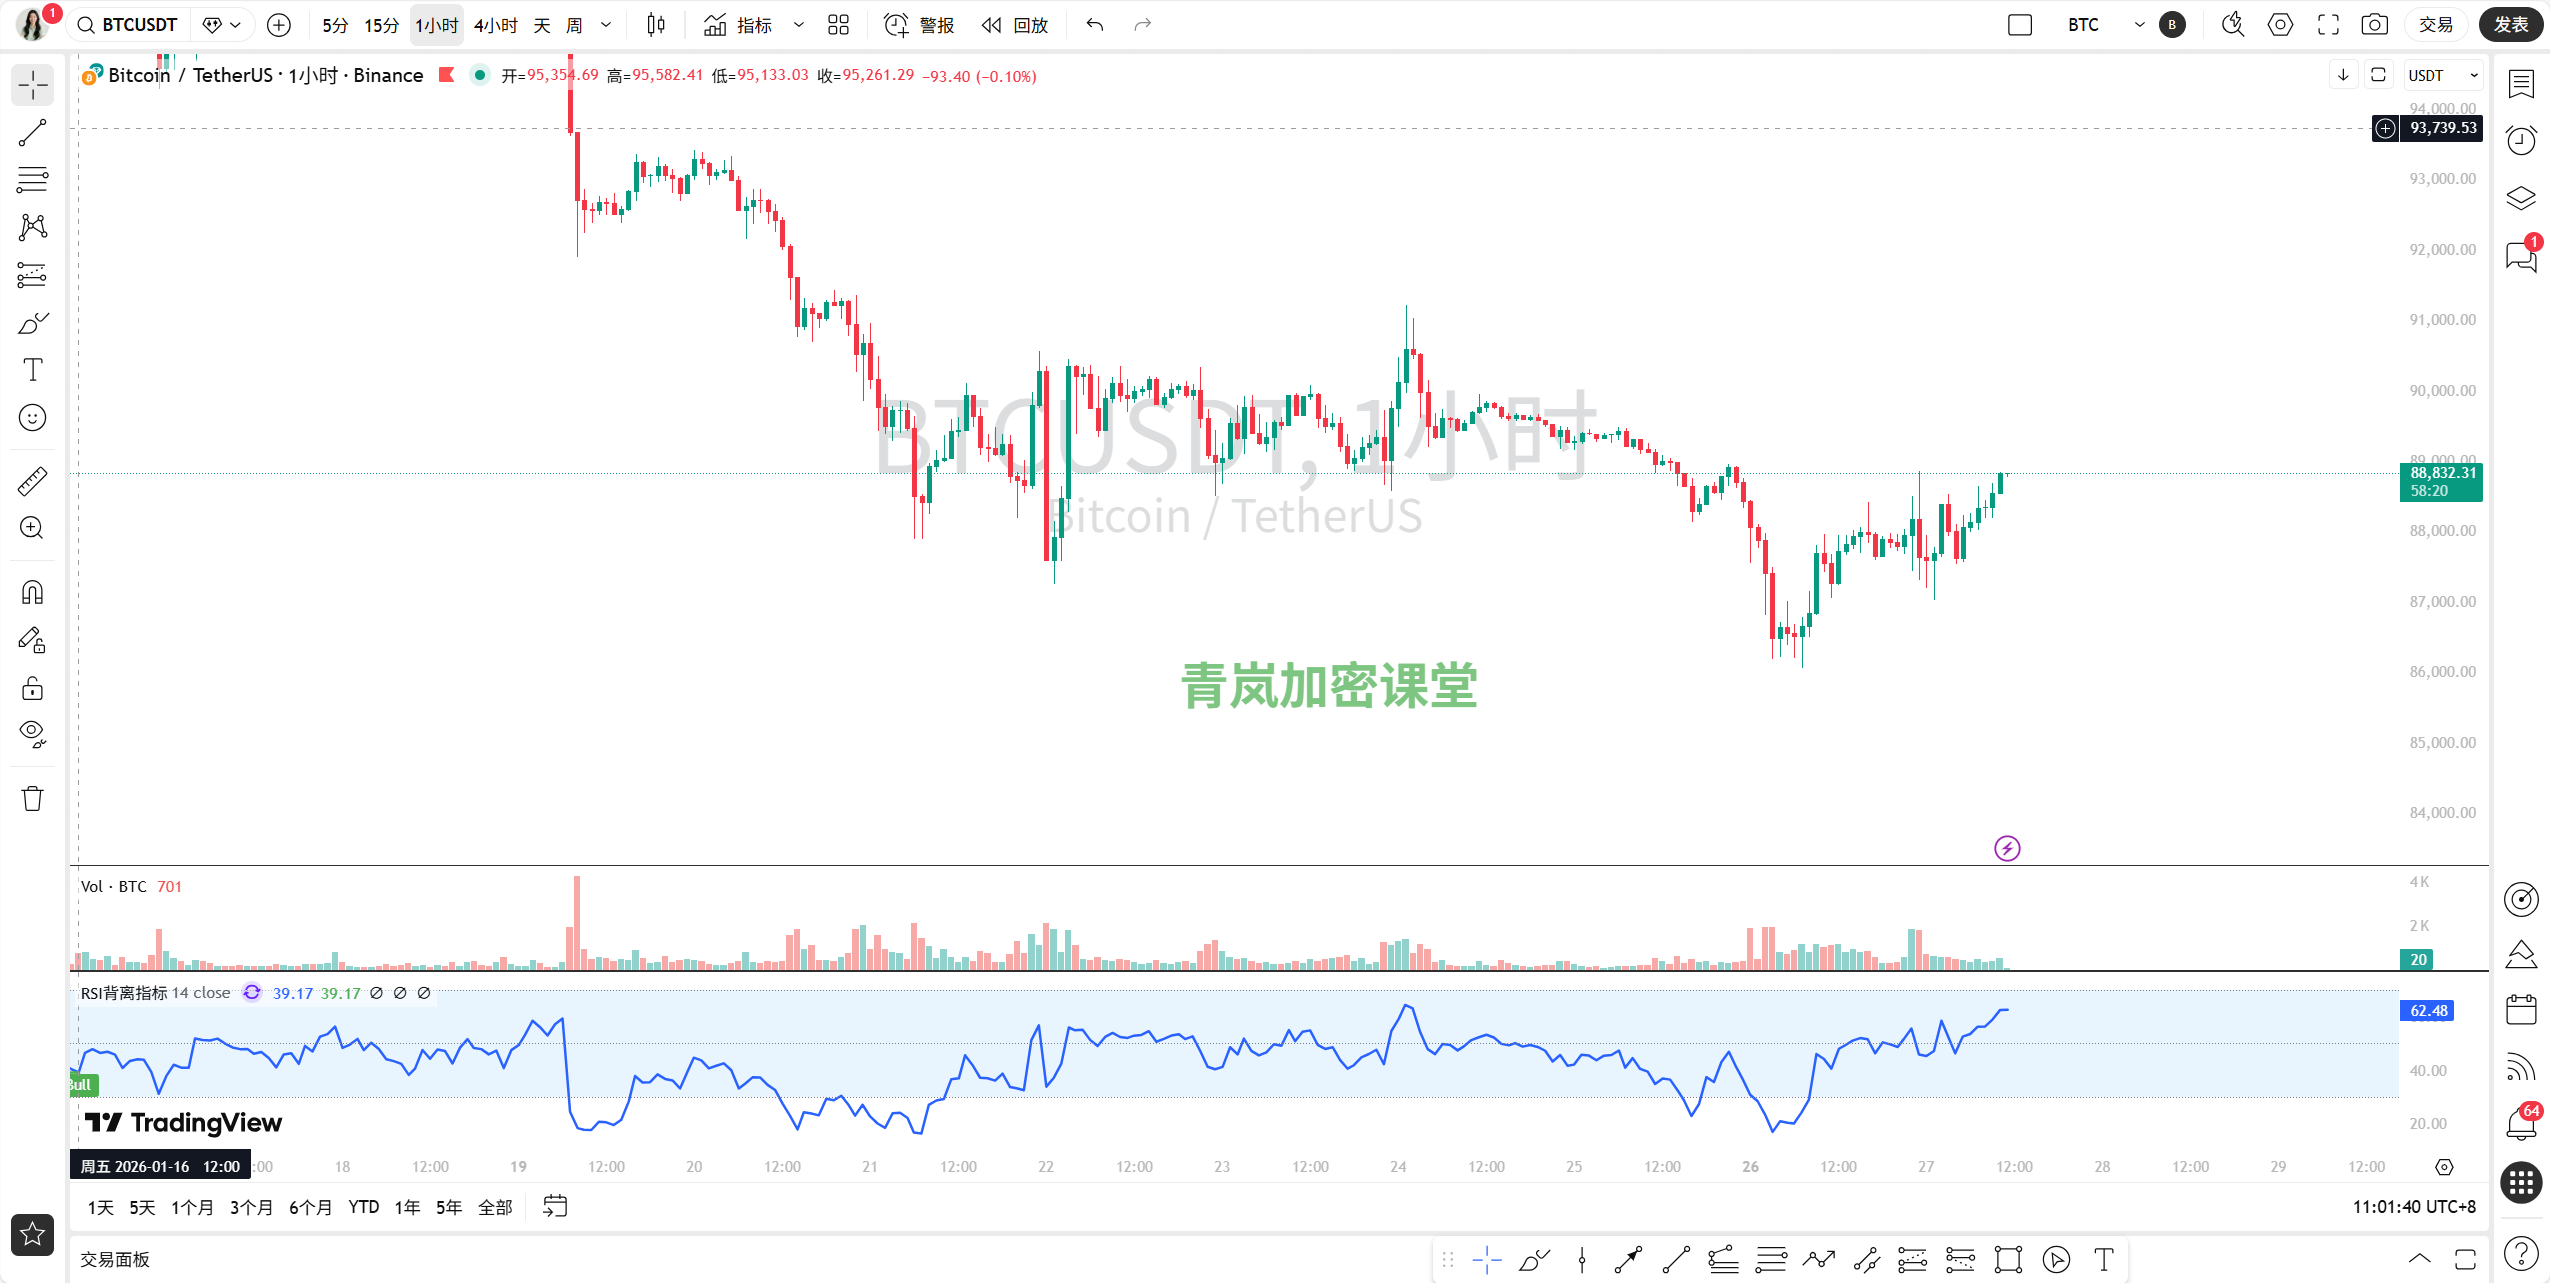
The 1-hour candlestick chart also reflects a strong rebound from a clear downtrend in the recent market. The price had dropped to around $86,500 a few days ago, then began to steadily recover, and has now reclaimed most of the lost ground, returning to the $88,800 area. In terms of technical indicators, the 1-hour chart's MA moving averages have also completed a bullish arrangement, with short-term moving averages above the long-term moving averages, which is a positive signal. The MACD indicator has also shown a golden cross, and the red bars are expanding, with the RSI rebounding from the extremely oversold level below 20 to above 60, all indicating strong short-term buying power and a repairing market sentiment.
From the short-term 15-minute and 1-hour charts, Bitcoin is currently in a strong rebound trend, with a strong bullish atmosphere.
- Medium to long-term trend: 4-hour & daily candlestick analysis
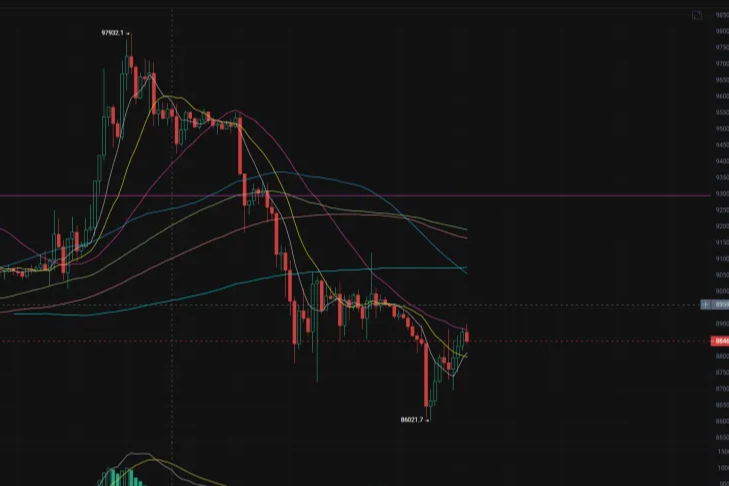
The 4-hour candlestick chart tells us that although there is a rebound in the short term, from a broader perspective, the price has previously experienced a clear downtrend, falling from $95,000 to $86,000. Now this rebound is making an effort to repair upwards. In terms of technical indicators, the 4-hour chart's MA moving averages have improved, with MA5 and MA10 starting to rise, but they are still below MA20, indicating that the medium-term downward pressure has not been completely lifted. MA20 (around $88,500) is currently a key resistance level we need to pay attention to. Although the MACD indicator has also shown a golden cross and the red bars are increasing, the RSI has only rebounded to the neutral zone from the oversold area, suggesting a potential shift in medium-term momentum, but we need to observe further whether it can break through and stabilize above this important resistance.
The daily candlestick chart clearly shows that since the peak in December last year, Bitcoin has been in a large-scale oscillating downtrend. The price is firmly suppressed by the daily MA20 moving average, making it difficult to break through with each rebound. The latest few candlesticks, although showing some minor rebounds, can only be considered local repairs within the overall downtrend. In terms of technical indicators, the daily MA moving averages are still in a bearish arrangement, with short-term moving averages below long-term moving averages, the MACD fast and slow lines are below the zero axis, the green bars are still extending, and the RSI is only in a weak neutral area, all clearly pointing to the fact that the long-term downtrend has not changed.
Therefore, our medium to long-term trend, especially from the daily perspective, is still downward. The short-term rebound we are seeing now is more like a correction or "dead cat bounce" after a significant drop, rather than a true trend reversal.
- News analysis and trading suggestions
Considering these 50 pieces of news, our market is indeed complex and contradictory!
The bearish news is somewhat heavy: The most concerning is the overnight ETF outflow of $1.73 billion mentioned in [33], which is quite a blow! The significant outflow of institutional funds indicates that they are not optimistic about the short-term market. [6] and [31] also mention the shrinking market cap of stablecoins, with funds flowing into traditional safe-haven assets like gold and silver, indicating that Bitcoin is not seen as a safe-haven choice, reflecting a decline in overall market confidence in crypto assets. [28] The risk of a potential government shutdown in the U.S. also brings macro-level uncertainty to the market. Historical data shows that Bitcoin is not a reliable safe-haven asset during such times. [16] and [43] have professional analysts, Qinglan and former Ark Invest executive Chris Burniske, giving bearish judgments and predicting lower buy-in prices, which increases market anxiety.
The bullish news mainly revolves around Ethereum and altcoins: [4], [41], [42] institutions like BitMine are significantly increasing their holdings in Ethereum, and [3] VanEck has launched an AVAX spot ETF, [8] Valour has been approved for an ETP in the UK, all showing institutional interest in specific crypto assets and promoting compliance in the entire industry, but these seem to have failed to boost Bitcoin, and may instead divert funds away from it. [1] Trump's support for stablecoin USD1 has brought some political attention, but its transparency has also raised doubts. [17], [35], [48] ZKP concept coins and AI-related projects have received huge financing and market attention, reflecting the technological innovation and vitality in the crypto field, but similarly, the direct boost to BTC is limited.
Comprehensive judgment and trading ideas:
The short-term strong rebound we are seeing now is more like a technical repair or "dead cat bounce" within the daily oscillating downtrend, rather than a true trend reversal. The large outflow of ETFs and the flow of funds into traditional safe-haven assets are very strong bearish signals.
Short-term (15-minute, 1-hour) trend: Upward, but the momentum may be difficult to sustain. Medium-term (4-hour) trend: Oscillating weakly, attempting to repair. Long-term (daily) trend: Downward.
Key support and resistance levels:
- Key resistance above: $88,800-$89,000: This is near the current highs on the 15-minute and 1-hour charts, as well as the area where the 4-hour MA20 is located, which may encounter strong resistance in the short term.
- $89,600-$90,000: A strong psychological barrier, also near the daily MA10.
- $91,400-$91,500: Daily MA20, if it can break through and stabilize here, we can say that the long-term trend has eased.
Key support below:
- $87,000-$87,400: The recent low point area on the short-term chart, also a psychological support.
- $86,000-$86,500: This is the recent low point of several declines, also a relatively strong medium to long-term support. If it breaks down, the space below will open further.
Possible reversal patterns: In the short term, if the price encounters strong resistance in the $88,800-$89,000 area and forms a top pattern (such as a double top or head and shoulders top), it is likely to test lower again. From a larger cycle perspective, it is still in a descending channel, and any rebound that is blocked at high levels may form a new "lower high," continuing the downtrend.
Our trading idea: Given the overall bearish macro and long-term technical outlook, we do not recommend blindly chasing highs in the short term. For the cautious traders: Be patient! Either wait for the price to effectively break through the daily MA20 ($91,400) and stabilize, or wait for it to drop to the strong support level below (such as $86,000 or even lower) and show clear stabilization signals, such as volume surges, bottom patterns, etc., before considering entry. For the aggressive traders: You can consider near the $88,800-$89,000 area, if you see the price stagnating or showing signs of decline, you can try to short with a light position, placing a stop loss above the resistance level (such as above $90,000). If the price unexpectedly breaks above $90,000, we must decisively execute our stop loss.
For more quantitative breakdowns of how real-time news affects market sentiment, it has been updated in my Qinglan Crypto Class: www.qinglan.org
Remember this: The wisdom of trading lies not in being right every time, but in knowing when to cut losses and when to wait.
免责声明:本文章仅代表作者个人观点,不代表本平台的立场和观点。本文章仅供信息分享,不构成对任何人的任何投资建议。用户与作者之间的任何争议,与本平台无关。如网页中刊载的文章或图片涉及侵权,请提供相关的权利证明和身份证明发送邮件到support@aicoin.com,本平台相关工作人员将会进行核查。