Today's content mainly revolves around the long-term trends of Bitcoin and Ethereum, systematically sorting out the current structure and core viewpoints.
The long-term outlook remains bearish, and we have not yet reached a price range suitable for accumulating spot positions.
- Daily Level: A New Round of Decline Has Begun
From the daily structure, Bitcoin has dropped from 98,000 to 86,000.
I personally do not believe this is a mid-term adjustment, but rather:
The beginning of a new downward trend.
The reasons are:
The original upward channel has effectively broken down.
The key trend line has been damaged, indicating the end of the previous adjustment.
Even if we redraw the channel, the structure still leans bearish.
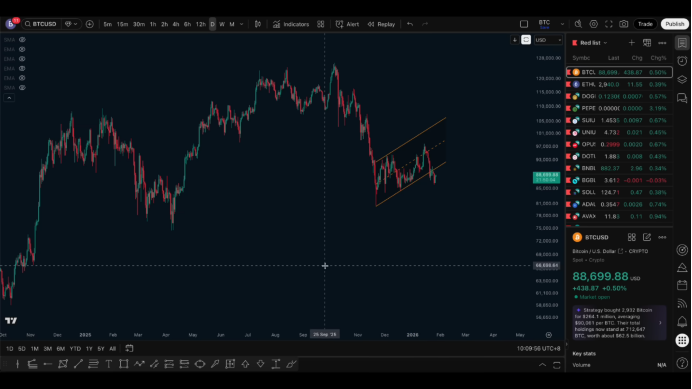
Therefore, at this position, my viewpoint is very clear:
The daily level has entered a new downward trend, with the overall direction continuing to be bearish.
- The Inducement Logic Around 97,000
Previously, around 97,000, I provided a medium to long-term short position alert, with the core logic coming from the daily structure:
This position is a historical resistance level.
A breakout occurred during the third test.
After the breakout, an inducement rally occurred, completing the short liquidation.
This was followed by the start of a new round of decline.
This type of movement also appeared in the previous downward cycle, with a structurally similar pattern.
Therefore, this segment is not an adjustment but the starting point of a trend continuation.
- Overall Structure: An Enlarged Version of the Top Structure
Overall, this segment of the market is an enlarged version of the top structure:
High points are continuously rising.
Low points are continuously probing lower.
Both bulls and bears are repeatedly liquidating.
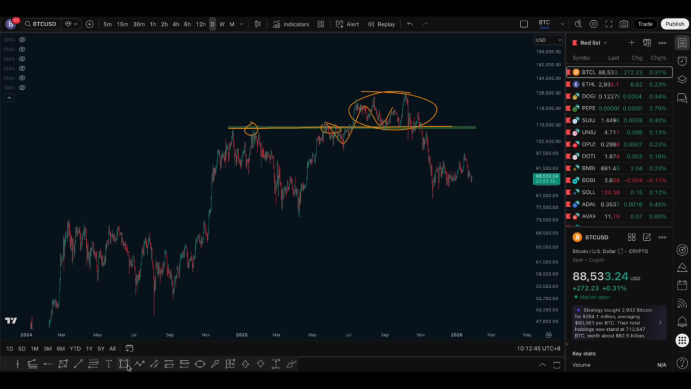
After the high point broke, there was no continuation of the rise, but rather a consolidation at a high level, trapping a large number of bulls who chased the highs; essentially, it remains an inducement structure.
- Key Ranges Below: 75,000 and 65,000
To complete the bull liquidation, the key is whether it breaks below the previous low:
The key low is at 75,000.
This round of decline will likely break below 75,000.
If a bottom is formed below, I am more inclined to see a complete 50% decline, corresponding to a price around 65,000.
Combining with the historical wide fluctuation zone:
65,000 is a densely exchanged area.
It usually has strong support characteristics.
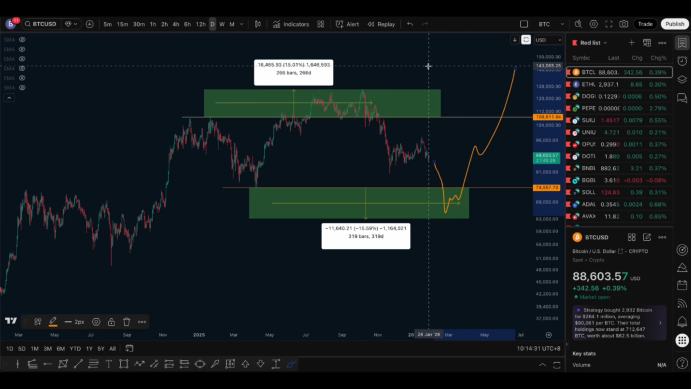
If we reverse the previous round's 15% upward extension, this round of decline will extend by 15%, with the price range roughly between:
65,000 and 60,000.
This also aligns with the previously provided spot attention range:
70,000 to 50,000.
- 4-Hour Level: Still No Reversal Signal
The 4-hour structure is very clear:
A single segment decline.
No bottom reversal signals.
No clear conditions for going long.
Yesterday's rebound long position was merely based on a technical rebound after breaking the low, strictly a quick in-and-out.
The current main direction is still to short.
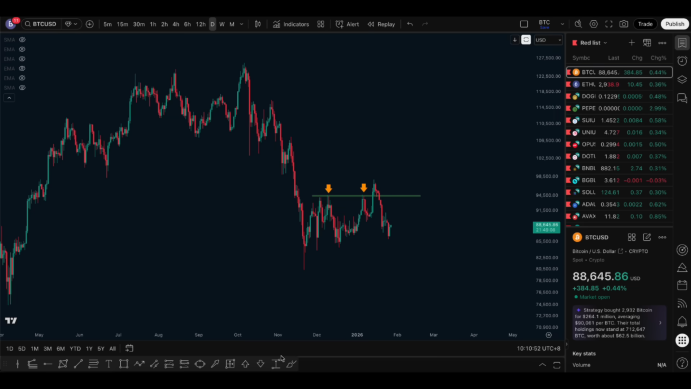
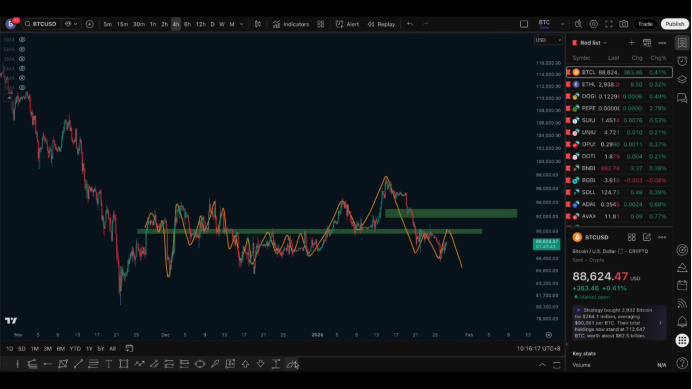
- Core Resistance Level: 90,000
The most critical position in the short cycle is at 90,000:
Multiple support and resistance exchanges.
After breaking, it has repeatedly tested but failed to stabilize.
It remains a core pressure point.
In terms of strategy:
90,000–91,000 is the main defensive zone.
Placing the defense point at 91,000 is relatively safer.
As long as 90,000 is not effectively broken, the main strategy remains to short on rallies.
If 91,000 is effectively broken, then a reassessment of the 92,000–93,000 range is needed, but currently, the probability is low.
- Summary
Daily Level: A new downward trend has been confirmed.
4-Hour Level: No bullish signals at present.
90,000 remains the core resistance.
Overall direction: Continue with a bearish mindset.
Follow me, join the community, and let's progress together.

免责声明:本文章仅代表作者个人观点,不代表本平台的立场和观点。本文章仅供信息分享,不构成对任何人的任何投资建议。用户与作者之间的任何争议,与本平台无关。如网页中刊载的文章或图片涉及侵权,请提供相关的权利证明和身份证明发送邮件到support@aicoin.com,本平台相关工作人员将会进行核查。