Waves in the Cryptocurrency Sea: Bitcoin (BTC) Market Analysis Reference for January 28:
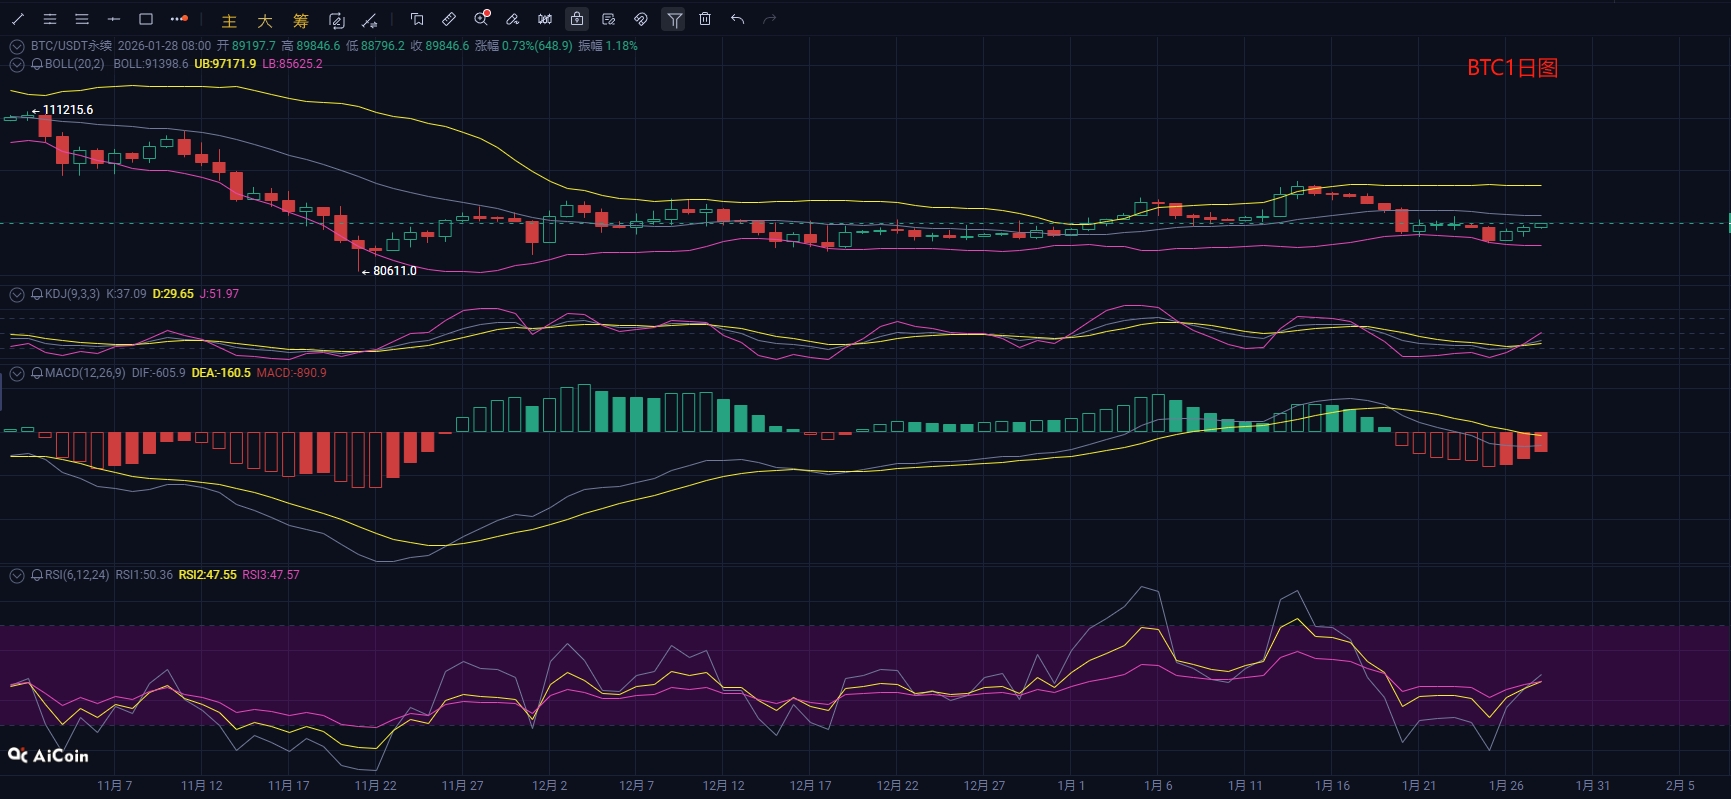
Bitcoin has recently rebounded, with the daily market continuing to fluctuate upwards. Although there have been pullback trends during the day, the overall bullish pattern remains intact, with the price currently operating around 89,500. Observing the daily chart, Bitcoin's daily candlesticks have consistently closed in the green, and the price is currently running below the middle band of the Bollinger Bands. The KDJ three lines are in the low area, with the J line turning upwards, forming a low-level golden cross, signaling a rebound after a short-term oversold condition. The MACD indicator is still operating below the zero axis, but the histogram is shrinking, and the DIF line is slightly turning upwards, indicating that the mid-term bearish momentum is waning, although a trend reversal signal has not yet been established. The RSI indicator has risen from a low level to around 45, with buying power gradually accumulating. Overall, BTC is currently in a phase of consolidation and repair after a pullback from previous highs, with a short-term technical rebound demand. Attention should be paid to the resistance around the middle band of the Bollinger Bands at 91,300; if it can effectively break through, further upward movement is expected.
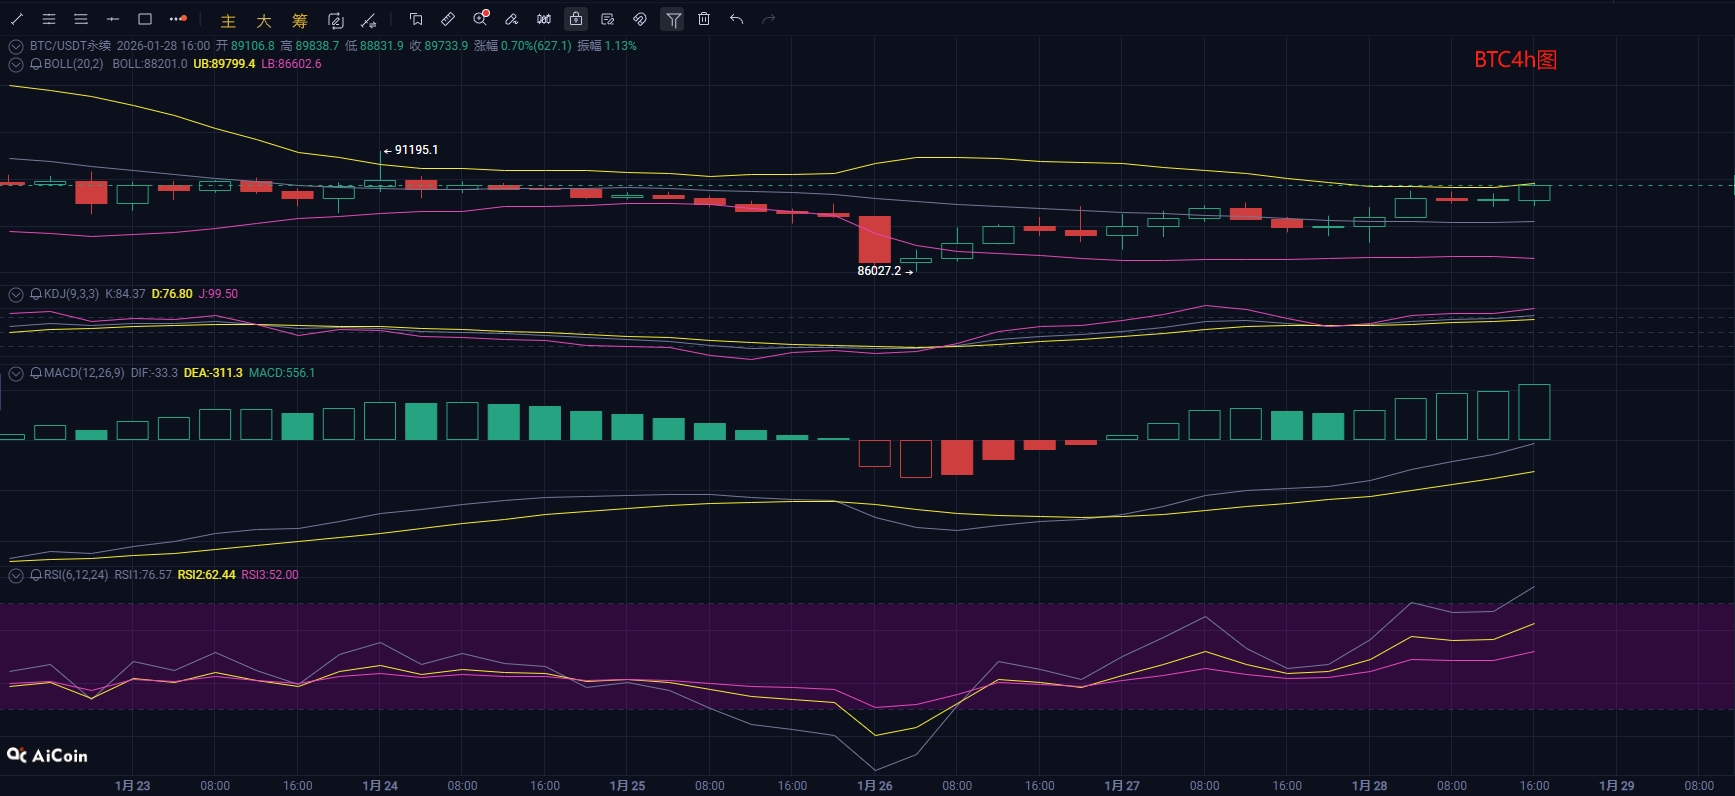
From the short-term hourly chart, on the 4-hour chart, the price has gradually stabilized and rebounded after previously dipping to a low of 86,000, currently operating above the short-term EMA. The EMA15 and EMA30 have formed a golden cross upwards, indicating a strengthening of short-term bullish momentum; the KDJ indicator shows that the J line has reached the overbought area, with the K and D lines rising together, indicating strong short-term rebound momentum, but there is also a pullback demand. The MACD indicator continues to expand, with the DIF and DEA diverging upwards and approaching the zero axis, indicating that short-term bullish momentum is still being released. Looking at the 1-hour chart, the Bollinger Bands are running upwards, with the price operating above the middle band, and the upper band forming short-term resistance. The KDJ indicator shows all three lines rising together, indicating strong short-term rebound momentum, but also facing pressure from a potential pullback after being overbought; the MACD volume bars are gradually expanding, and the DIF and DEA are showing a golden cross, indicating that bullish momentum has not faded, just weakened. Overall, short-term bullish momentum is dominant; if it can break through the upper band of the Bollinger Bands with volume, the short-term bullish trend will be further strengthened, and the rebound trend is expected to continue. At that time, attention should be paid to the strength of resistance levels above, and it is recommended to enter long positions on pullbacks to lower levels.
Waves in the Cryptocurrency Sea: Short-term Reference for Bitcoin on January 28:
Short Position: Sell in the range of 91,000-92,000, stop loss at 500 points, target below 90,000.
Long Position: Buy in the range of 87,500-88,500, stop loss at 500 points, target above 89,000.
Waves in the Cryptocurrency Sea: Short-term Reference for Ethereum on January 28:
Short Position: Sell in the range of 3,100-3,150, stop loss at 30 points, target at 3,050-3,000.
Long Position: Buy in the range of 2,935-2,965, stop loss at 30 points, target at 3,000-3,100.
【The above analysis and strategies are for reference only. Please bear the risks yourself. The article's review and publication may have delays, and the strategies may not be timely. Do not operate blindly.】

The content of this article is originally shared by 【Waves in the Cryptocurrency Sea】 and represents personal opinions only. The article may have delays in sending and is for reference only; do not operate blindly! If you want to get more real-time trades daily, follow my public account! Here, you can engage in online technical learning and understand knowledge related to exiting positions. I have years of research experience in the market, focusing on the major trends in the cryptocurrency space. I am mainly responsible for analyzing and guiding investment operations for BTC, ETH, DOT, LTC, FIL, EOS, BCH, ETC, and other cryptocurrencies. Welcome to study and research together.
I hope everyone on their investment journey can adhere to their principles, regardless of how the market changes. Stay rational and calm. Deeply understand the characteristics, risks, and profit mechanisms of investment products, and do not let short-term market fluctuations affect your emotions. Be patient, avoid excessive greed and fear, and understand that wealth accumulation is a gradual process. Finally, I wish all my followers the ability to see opportunities in their investment journey, making every decision just right, sailing through the ocean of investment, and reaping wealth and growth!!!
免责声明:本文章仅代表作者个人观点,不代表本平台的立场和观点。本文章仅供信息分享,不构成对任何人的任何投资建议。用户与作者之间的任何争议,与本平台无关。如网页中刊载的文章或图片涉及侵权,请提供相关的权利证明和身份证明发送邮件到support@aicoin.com,本平台相关工作人员将会进行核查。