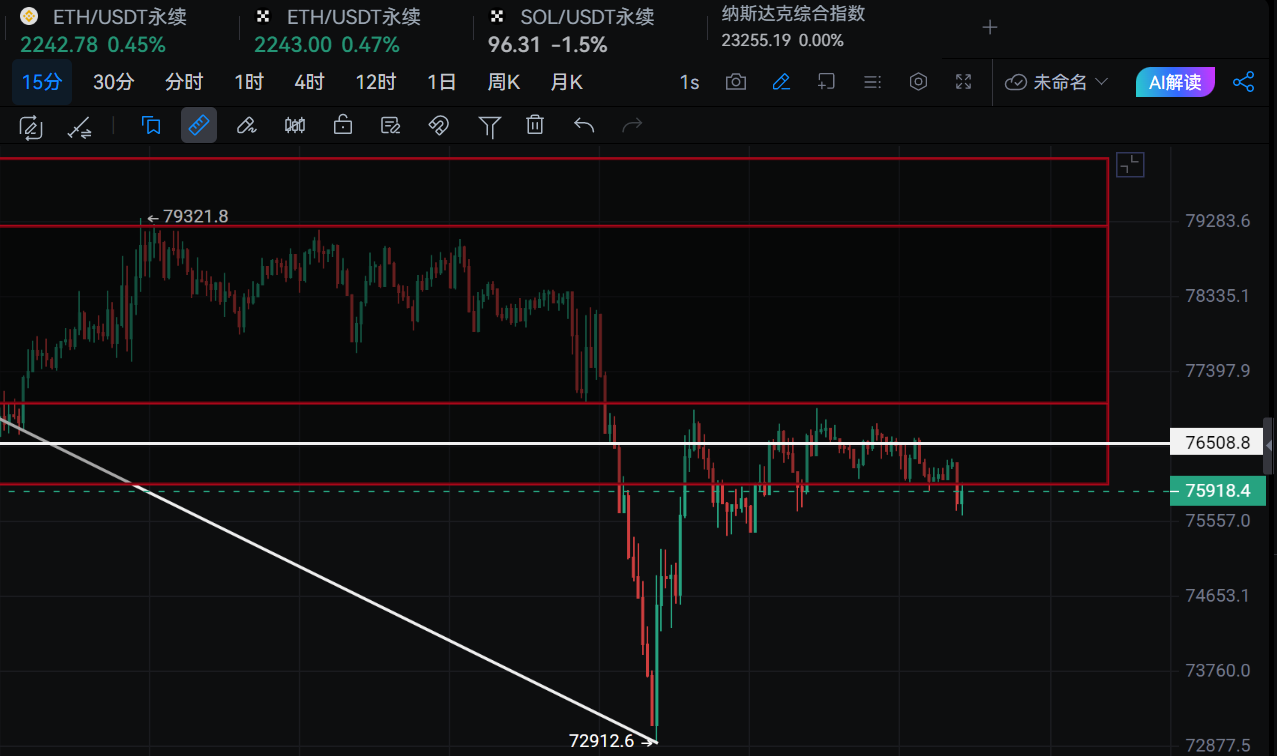
Let's briefly review the recent price action of Bitcoin, which dropped from around 78,000, with three progressively larger bearish candles in one hour, bringing the price down to around 73,000. The lowest point of the first candle and the plunge point of the second candle are key levels to watch, particularly around 76,500. The solid line that faced resistance after the spike and the main range of fluctuations during the day also align with this level. See, isn't this position an absolute divergence point for the main players?
At 3 AM on February 4, when Bitcoin rebounded, the hourly KDJ passively formed a golden cross. The previous KDJ and RSI should have actively formed a golden cross, and the majority of bullish positions in the market were optimistic about the relay point around 77,200. Therefore, this round of decline was purely a technical suppression. The long positions that were liquidated from 78,000 to 73,000 amounted to just over 100 million dollars, which is very small compared to previous similar declines.
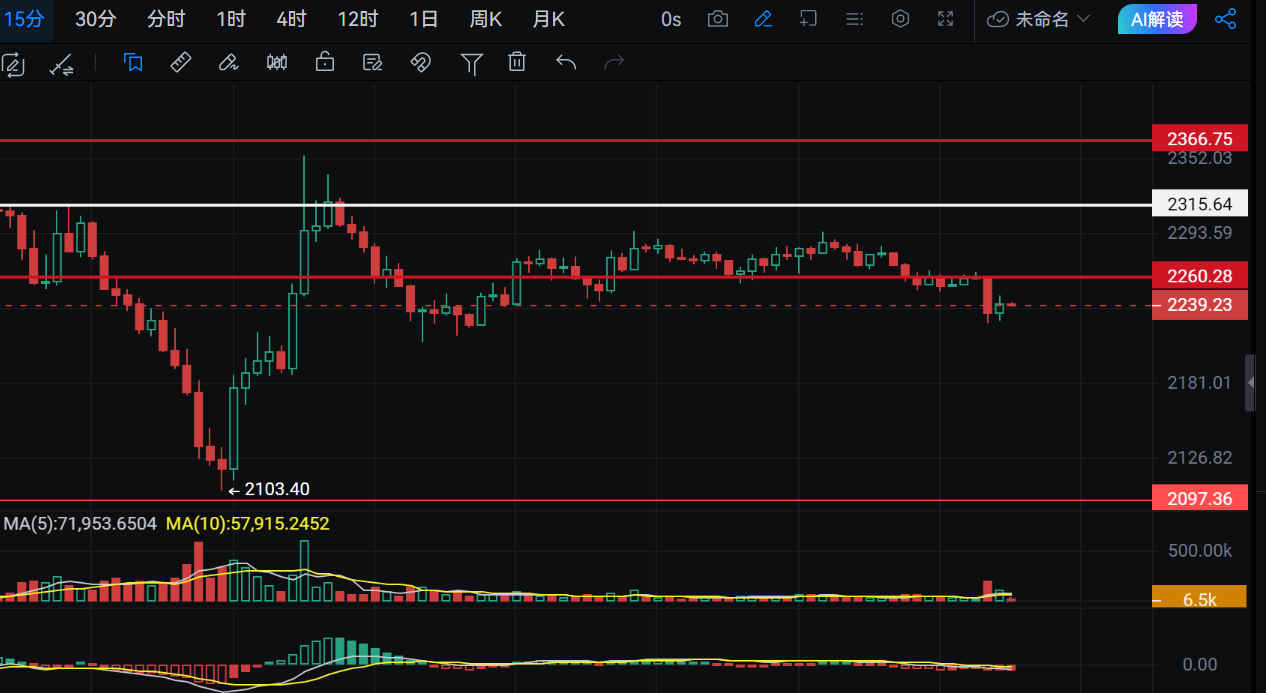
Ethereum is similar in this regard. Ethereum's overall rhythm is stronger than Bitcoin's, whether in terms of the magnitude of rises and falls or short-term divergences. At 3 AM, three bearish candles starting from around 2,300 could drop 200 points, while during the rebound, two bullish candles recovered above the starting drop point. The pullback fluctuated around 2,250, spending most of the time above this level. We should note this detail: this position is above the lowest point of the first bearish candle at 2,240, while Bitcoin's corrective consolidation is mostly below 76,500. This already indicates a divergence in market behavior.
This detail leads us to infer that Bitcoin is highly likely to oscillate back above 76,500, while Ethereum may take the opportunity to test resistance. We can subjectively deduce that the high-leverage long positions around 80,000 have already been liquidated, and the price needs more support from spot trading. The best approach would be to trap a batch of stubborn bulls (above 80,000) and oscillate in a position that is not very attractive to bulls.
For the market makers, accumulation must be completed during times of market panic. This process, along with the preparation for the second wave of the market, requires time. The higher the risk, the less one should accumulate; the lower the risk, the more one can accumulate. Currently, Bitcoin's position around 75,200 can be seen as a potential accumulation zone, but this is just a subjective assumption from me.
Currently, the one-hour and four-hour moving averages are pulling downwards. As of now, Bitcoin's position has reached the lowest spike at 73,000 and is in the middle of the one-hour EMA 120. Ethereum's one-hour EMA 120 is still around 2,400, with the main fluctuation range at 2,250, barely sitting between the lowest spike and the upper resistance. In the future, we will focus on the left side, and in the short term, we can just keep taking risks for rebounds.
For Bitcoin, key levels to watch below are 74,800 and above 73,500, with attention on 76,500, 77,200, and 78,500.
For Ethereum, watch below at 2,212 and above 2,168, with key levels at 2,275, 2,320, and 2,380.
For Bitcoin, we can start entering around 75,500 for a rebound, add at 74,500, and set a stop loss at 73,500. For Ethereum, we can start at 2,220, add at 2,180, and set a stop loss at 2,152. If being conservative, one can add positions to enter. If looking to short, enter at 78,350 with a stop loss at 79,150, while for Ethereum, consider entering at 2,320 with a stop loss at 2,352.
Supporting a bountiful year, WeChat Official Account: New Yasha Talks About Trading

免责声明:本文章仅代表作者个人观点,不代表本平台的立场和观点。本文章仅供信息分享,不构成对任何人的任何投资建议。用户与作者之间的任何争议,与本平台无关。如网页中刊载的文章或图片涉及侵权,请提供相关的权利证明和身份证明发送邮件到support@aicoin.com,本平台相关工作人员将会进行核查。