Ethereum #Bitcoin #EthereumRealTimeAnalysis #BitcoinRealTimeAnalysis
Hello everyone, I am Lao Lv. The bullish outlook is not optimistic. We have been mentioning this for the past few days because the strength of the rebound has always been insufficient. Although there has been a significant short-term rebound, the upward pattern has not emerged; it has only been a single bullish candle, directly pulled up from the bottom, and ultimately broke to a new low. My concerns moving forward are twofold: First, continuing to rapidly rise to repair the oversold conditions in the downtrend without stopping the decline. Second, in terms of pattern, there is a lack of a sharp decline. In our previous analyses, we often mentioned that in a downtrend, the most concerning scenario is when the price refreshes a low, pulls up, and continues to refresh a low without showing a strong daily-level rebound. Our original plan was to see a strong rebound at 73333 and 2110, but clearly, this situation did not occur. The rebound at 73333 peaked at 77000, still falling short of 5000, while Ethereum at 2110 rose to a maximum of 2344. The strength is decent, but for the bulls to stop the decline, this strength is still insufficient. This is also why we have maintained this concern until yesterday. This is the market; in the short term, it may move according to your wishes, but the future may not fully meet expectations. At this point, we have to make a decision: 73333 dollars and 2110 are not the bottom at all, but rather a brief support on the weekly chart! In the future, we still lack an acceleration pattern.
As for Ethereum, today we must first say that history is remarkably similar. In this type of decline, we still found rules in historical trends, specifically the segment from 3250 to 2621, which is precisely the segment I am worried about—refreshing a low, then rebounding, and continuing to refresh a low. On November 20, there was a rapid decline, ultimately dropping 440 dollars and bottoming at 2621. The previous pattern is completely consistent, but the current pattern lacks a continuous bearish pattern. Therefore, we must change our mindset from going long at low levels to going short at high levels. Yesterday, we used the 2050 position as bait, essentially to see if the price would indeed reach this point. Under the support of 2050 dollars, there was another rebound, and I knew that the most troublesome situation was about to occur. Currently, Ethereum has been moving in a downtrend channel alongside Bitcoin, and it has not broken below the channel, so the probability of finding a bottom in the short term is small. Recently, it has been quite miraculous; within the downtrend, 0.786 has played a magical role. This time, we are making a bold decision to short Ethereum! Let me explain my reasoning. We only act as a precursor, stating the basis in advance, which has two points: First, the price is slowly declining and refreshing lows, lacking a sharp acceleration to break below the descending channel line. Second, starting from 2474 dollars, the price has been continuously refreshing lows, and after recovering 0.786 of the decline, it continues to break new lows. Today, we continue to wait for an opportunity, a major short below 0.786!
This position refers to 2286, which is the 0.786 of the rebound point. This is the downtrend rule given to us by previous movements. Additionally, 2286 is also the starting point of the significant drop last night, which can serve as the opening for the decline. Our overall operation shifts from going long at low levels to going short at high levels. The bottom support level below is 1750, which is a densely packed support level on the daily chart and also a densely populated suburban area from previous buying. Furthermore, the watershed for the bulls is 1580; if you break below this, it’s hard to say whether it’s a bull or bear market. The capital may be lost, and there’s a possibility of losing everything. This article represents a 360-degree attitude shift like never before; remember to set stop-losses for any operations. Currently, the entire trend is fluctuating significantly, and it is essential to pinpoint key positions. The entire trend requires a high level of skill from traders because the ups and downs are not coherent.
Ethereum is approaching 2286 for a major short, watching for the trend line to break, as shown in the image.
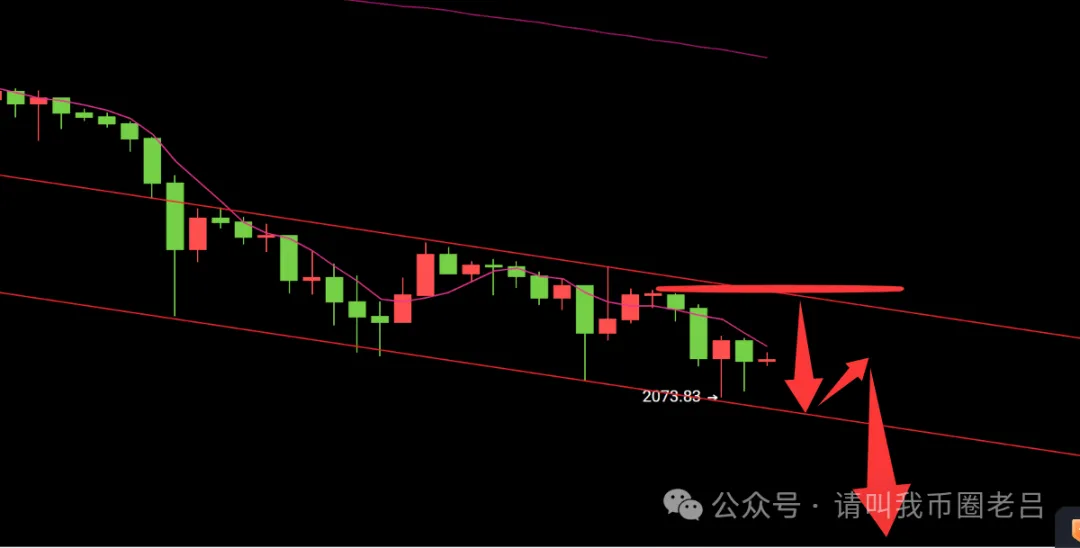
Bitcoin, currently the entire descending channel is consistent with Ethereum, but it still lacks acceleration. Therefore, in the short term, the price of 73333 may not necessarily become a new bottom. For those holding spot, I suggest exiting at this position for now. The current trend cannot become a new bottom. Yesterday, going long at Ethereum 2050 was merely a probing bait. If the price wants to strengthen, a second retest should not hit our 2110 stop-loss but should pull back 70% from the highest point and then go straight up. The result accelerated with a strength of 130%. Therefore, Bitcoin should also follow this rule. In terms of points, the short position for Bitcoin is unclear, referencing 74980 and 75840. The upper limit should not break significantly above 77300, which is the position from last night’s decline, or temporarily do not consider the entry position for Bitcoin but rather watch when Ethereum quickly approaches 2286 dollars. When it gets close to 2286 dollars, that will be the short price for Bitcoin, using Ethereum as a reference.
Predictions are predictions, and risks are risks; these are two different matters. Currently, from the perspective of the decline, the weekly chart indeed has provided support, but according to the pattern, it has been continuously breaking new lows. The four-hour chart has been in a bottom divergence pattern, and this divergence has not been repaired. It is evident that a quick rebound is used to temporarily repair the divergence, followed by an accelerated decline to reach the normal indicators. This segment is consistent with the pattern from November 14 to November 21 last year. Almost every day, looking at the four-hour indicators, there is a bottom divergence, and the price declines while facing the divergence. It was only on the 21st that it accelerated and was able to repair. Therefore, sometimes when seeing this divergence, it does not necessarily mean a complete bottoming pattern. It is essential to look at how the candlesticks move. Lao Lv's overall mindset has shifted significantly; willing to take risks and accept losses. The reasons and justifications are all in the article.
Today: Written by Lao Lv on February 5, 2026, at 8:40 AM. Note that all strategies are effective once and cannot be reused! Follow the text version and specific entry prices in the lower right corner of the image or video.
免责声明:本文章仅代表作者个人观点,不代表本平台的立场和观点。本文章仅供信息分享,不构成对任何人的任何投资建议。用户与作者之间的任何争议,与本平台无关。如网页中刊载的文章或图片涉及侵权,请提供相关的权利证明和身份证明发送邮件到support@aicoin.com,本平台相关工作人员将会进行核查。