Overall Trend of Bitcoin
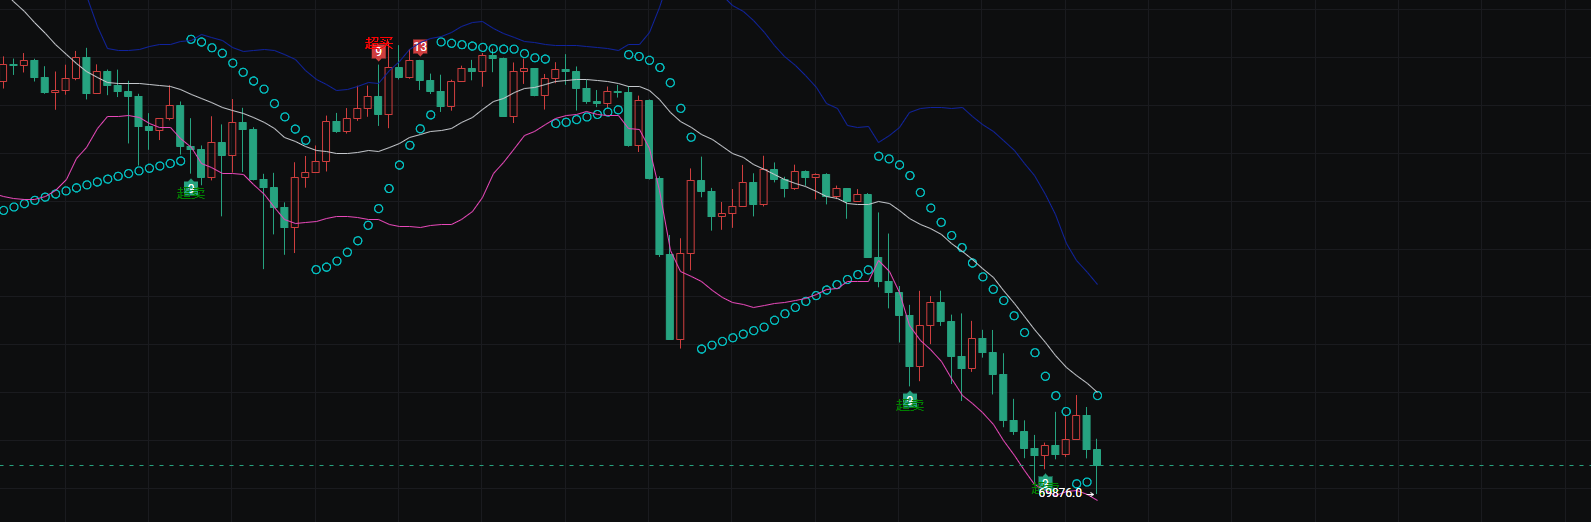
From the chart, it is clear that there is a distinct downtrend.
The price has fallen from a high near 80,000 to a low of about 69,970.
The moving averages in the chart (white, pink, blue) are in a bearish arrangement, and the price continues to operate below the moving averages, which is a typical weak signal.Interpretation of Technical Indicators
K-line Pattern: Recently, there have been consecutive large bearish candles, indicating strong bearish momentum and a bearish market sentiment.
Support and Resistance: The current price has found temporary support near the 70,000 round number, but the effectiveness of this position still needs to be observed. The key resistance above can refer to the recent rebound high of 72,200, as well as the moving average pressure level further up.
Indicator Signals: The scatter indicator in the chart (light blue circles) and the moving average system are both trending downwards without any significant divergence or reversal signals, indicating that the downward momentum has not yet fully exhausted.Short-term Trend Projection
Continued Decline: If the 70,000 level is effectively broken, the next support level may look towards 69,000 or even lower key positions.
Technical Rebound: If the price can stabilize around 70,000, a rebound targeting the 72,200 resistance level may occur, but under the backdrop of a downward trend, the height of the rebound may be limited.🎯 Key Resistance Levels
First Resistance Level: 72,000–72,200, which is the recent rebound high and also the dashed pressure level in the chart. Only by breaking through here can further rebound space be opened.
Second Resistance Level: 74,000–75,000, which is the bottom of the previous consolidation platform and an important pressure area of the moving average system.
Third Resistance Level: 77,000–78,000, which is the high point of the intermediate rebound during this round of decline and a key watershed for bullish and bearish forces.
🛡️ Key Support Levels
First Support Level: 69,900–70,000, which is the recent low and also a round number, representing the current core support.
Second Support Level: 69,000–69,500, which is a potential support extending from previous important lows. If 70,000 is broken, this position will need to be closely monitored.
1. Overall Trend of Ethereum
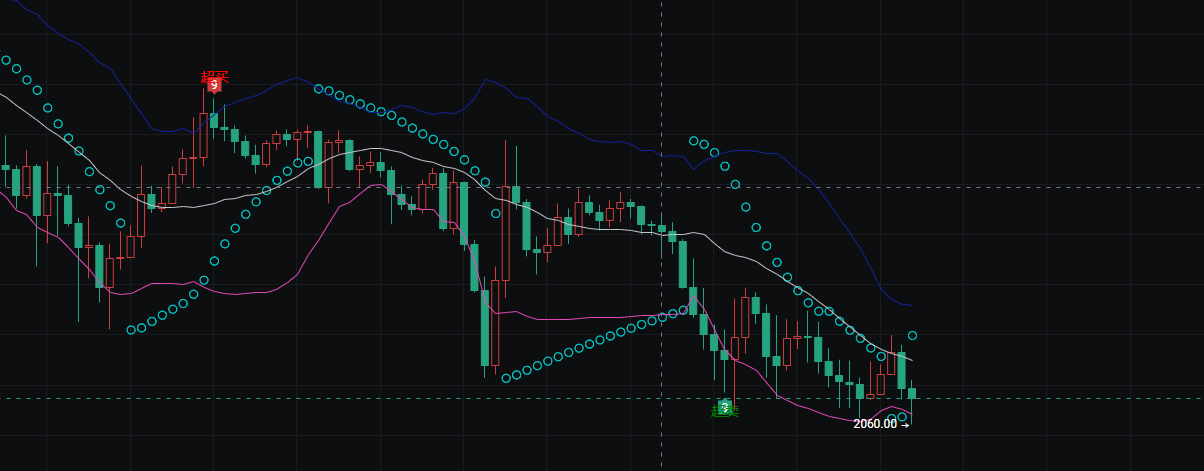
This is a clear mid-term downtrend, with the price continuously retreating from previous highs and currently falling to around 2060.
The moving average system in the chart (white, pink, blue) is in a bearish arrangement, and the price continues to operate below the moving averages, indicating that the market is overall weak.
2. Technical Details
K-line Pattern: Recently, there have been consecutive bearish candles accompanied by increased volume, showing that bearish forces still dominate the market.
Indicator Signals: The scatter indicator and moving average system in the chart are both trending downwards without any significant bottom divergence or reversal signals, indicating that the downward momentum has not yet fully released.
Support and Resistance: The current price has found temporary support at the 2060 round number, but the effectiveness of this position still needs to be observed.
3. Key Support and Resistance Levels
Key Resistance Levels:
The first resistance level is in the 2100–2120 range, which is the recent rebound high and moving average pressure level;
The second resistance level is in the 2200–2250 range, which is the bottom of the previous consolidation platform.
Key Support Levels:
The first support level is near 2060, which is the current low and a round number;
The second support level is in the 2000–2020 range, which is a potential support extending from previous important lows.
4. Short-term Trend Projection
If the 2060 support level is effectively broken, the price may drop to the 2000 round number seeking stronger support.
If the price can stabilize around 2060, a technical rebound targeting the 2100–2120 resistance level may occur, but under the backdrop of a downward trend, the height of the rebound is expected to be limited.

Note: 📣 Due to the limited timeliness and depth of information on public platforms, the market is ever-changing. Key turning points, precise operational strategies, and sudden risk alerts need to be synchronized in real-time on the official account. Here, you can obtain: real-time strategy updates, in-depth analysis support, interactive Q&A, risk warnings, and optimization suggestions for personal holdings. 🚨 Remember: The market always rewards those who act faster and have more accurate information! Be a winner among the minority.)
免责声明:本文章仅代表作者个人观点,不代表本平台的立场和观点。本文章仅供信息分享,不构成对任何人的任何投资建议。用户与作者之间的任何争议,与本平台无关。如网页中刊载的文章或图片涉及侵权,请提供相关的权利证明和身份证明发送邮件到support@aicoin.com,本平台相关工作人员将会进行核查。