Written by: ChandlerZ, Foresight News
Starting from 8:00 on February 5, Bitcoin dropped from $73,000, reaching a low of around $60,000 by 8:00 on the 6th, with a 24-hour decline of nearly 18%. It has since rebounded to around $64,000. Consequently, the Bitcoin price range has fallen back below the $69,000 mark, which was the peak of the 2021 bull market.
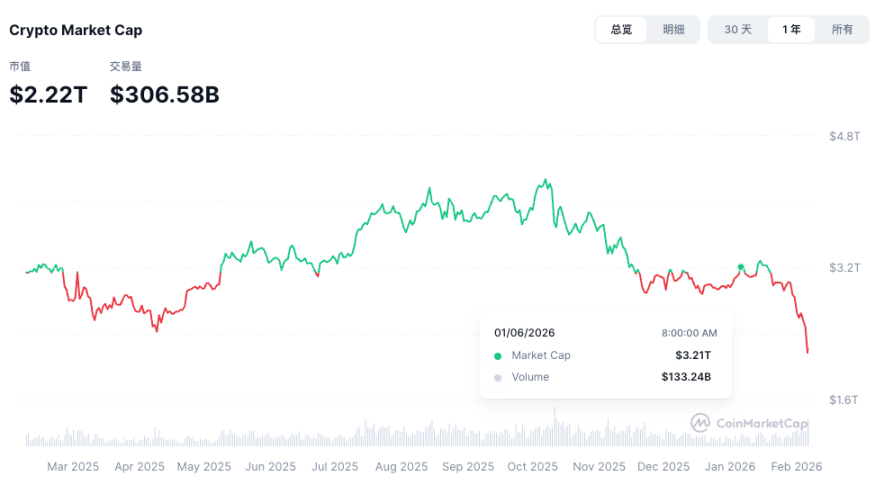
The altcoin market also saw widespread declines, with ETH dropping from $2,200 to a low of $1,750, and SOL falling from $92 to below $68. According to CoinMarket data, the total market capitalization of the cryptocurrency market has plummeted from $3.21 trillion to $2.22 trillion in just one month, losing $1 trillion in value.
According to Coinglass data, the total liquidation amount in the cryptocurrency market over the past 24 hours reached $2.688 billion, with $2.3 billion in long positions being liquidated.
In the global market, the S&P 500 index closed down 84.32 points, a decline of 1.23%, while the Nasdaq fell by 1.59%. Bitcoin treasury company Strategy saw a single-day drop of 17%, currently reported at $106.99, down over 76% from its peak in July 2025. Spot gold fell by 4%, briefly dropping below $4,700, while silver plummeted by 19%, nearing the $70 mark.
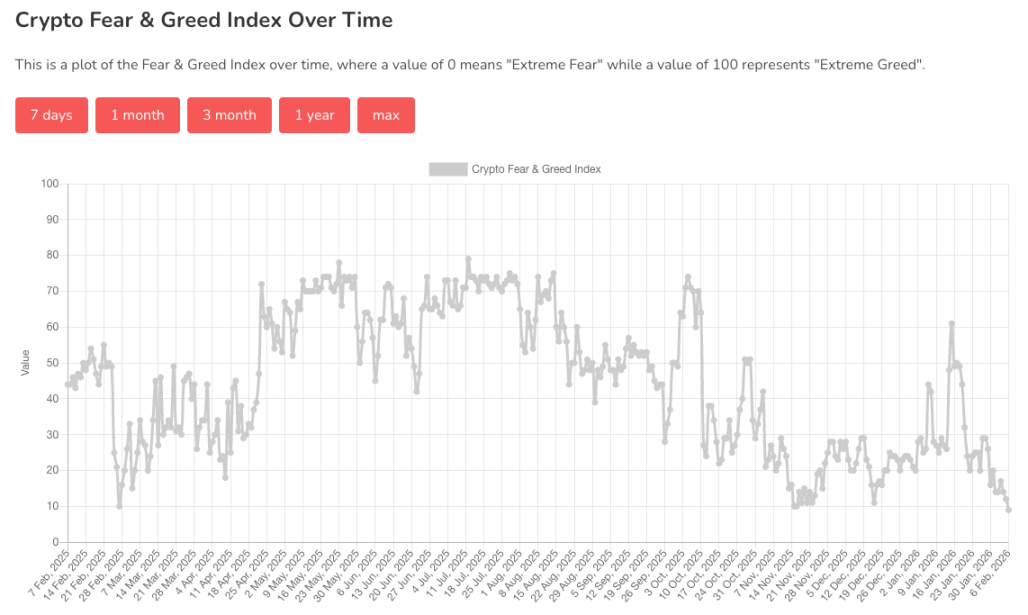
According to Alternative.me data, the cryptocurrency fear and greed index dropped to 9 today (down from 12 yesterday, indicating "extreme fear"), approaching a one-year low, indicating that the market is in a state of "extreme fear."
For many traders, the $69,000 mark carries memories of the previous bull market, and breaking below it signifies much. In the historical narrative of the cryptocurrency market, each bear market's bottom has been above the previous bull market's peak, which has almost been regarded as a rule. However, the market trend in 2022 challenged this cycle for the first time. After Bitcoin reached an all-time high in November 2021, it entered a prolonged downtrend.
This round of market activity has also broken below the previous bull market's peak, and the repetition of this scene seems to validate that regardless of how the macro and market environment changes, Bitcoin's four-year cycle is still in operation. Similar to the drop below $20,000 in 2022, losing the critical psychological level of $69,000 is yet another blow to market confidence. What happened after the last drop? Can it provide us with some insights for "carving a boat to seek a sword"? Should we buy the dip?
What Happened After the Last Peak Was Broken
In mid-June 2022, after 220 days of decline from its peak, Bitcoin's price fell below $20,000, which is near the psychological level of the 2017 bull market peak. This period was characterized by a significant monthly decline, with Bitcoin's price dropping nearly 43% in June 2022, marking a rare monthly retracement in many years.
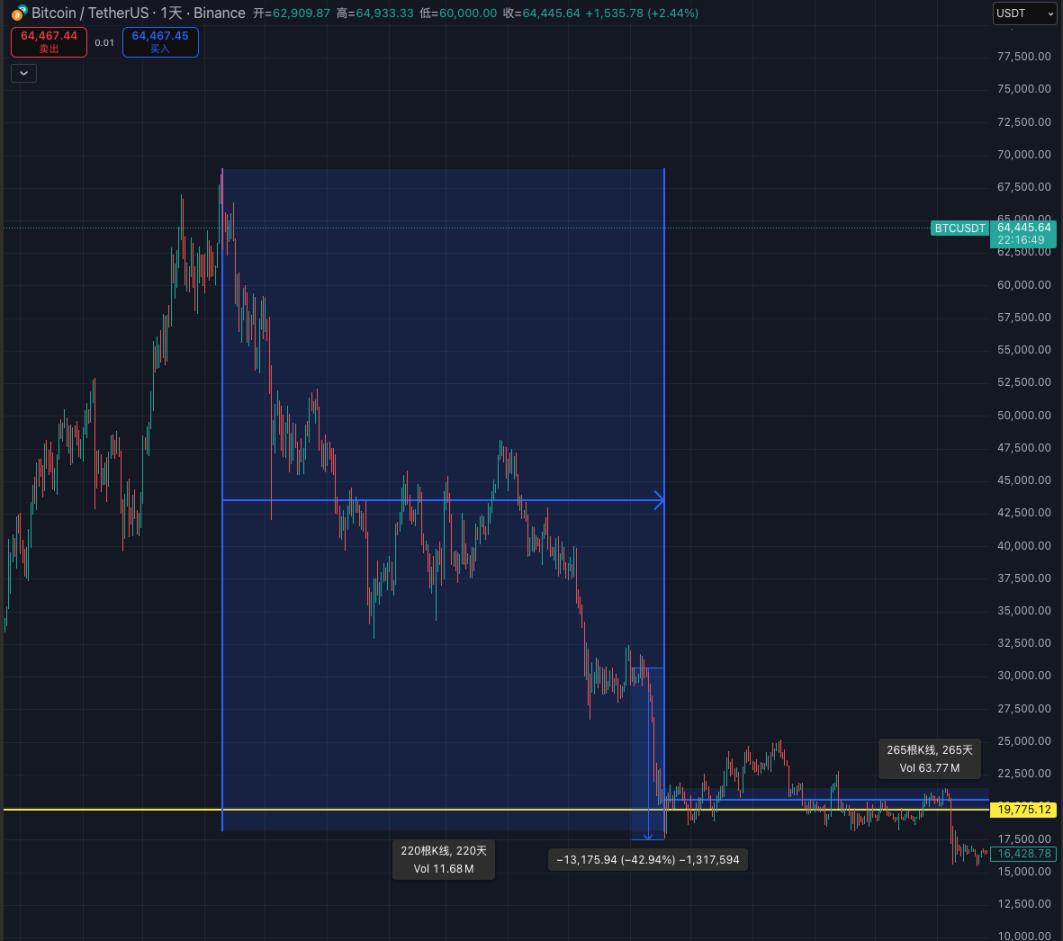
The impact of this event was enormous. It meant that investors who bought near the 2017 bull market peak and held on were now in a state of unrealized losses. Market confidence was severely shaken, and the cyclical belief that "bear markets do not break previous highs" was first broken by the mainstream market cycle.
After breaking below, the market did not immediately find support. Selling pressure continued to emerge, and Bitcoin's price further declined, reaching a low of about $17,600 around June 18. At this point, market panic reached its peak. On-chain data showed signs of whales reducing their holdings, and long-term holders began to waver, with various fear and greed indices pointing to "extreme fear." The characteristic of this phase was that price declines were accompanied by a significant increase in trading volume, indicating that a large number of investors chose to exit the market.
The Combined Effect of Macroeconomic Headwinds and Internal Industry Crises
The price collapse was not an isolated event; it was the result of macroeconomic headwinds and the concentrated outbreak of internal industry risks.
Firstly, on the macro level, the Federal Reserve initiated the most aggressive interest rate hike cycle in decades to combat high inflation. Global liquidity tightened rapidly, putting significant valuation pressure on all risk assets, including U.S. stocks and Bitcoin. During a strong dollar cycle, Bitcoin exhibited a high positive correlation with tech stocks like the Nasdaq index, both entering a downward mode.
Secondly, within the cryptocurrency industry, a series of black swan events followed one after another. From the collapse of the Terra/LUNA algorithmic stablecoin in May to the liquidity crises and eventual bankruptcies of well-known institutions like Three Arrows Capital and Celsius in June, market leverage was violently cleared. The forced liquidations and bankruptcies of these institutions created a death spiral, providing direct selling momentum for Bitcoin's price decline. Breaking below $20,000 was a direct consequence of these internal risks concentrating and exploding.
What Happened Afterward
From the time Bitcoin broke below $20,000 in June 2022 to the final low of this bear market (around $15,500) after the collapse of the FTX exchange in November of the same year, the market experienced a five-month bottoming consolidation phase. During this period, the price attempted to rebound multiple times but failed to effectively hold above $20,000, with market confidence extremely fragile.
The collapse of FTX was the final blow, completing the last phase of deleveraging in the market. An important market signal was that, under the extreme panic triggered by the FTX collapse, Bitcoin's price did not drop significantly below the low caused by institutions like Three Arrows Capital in June, indicating that the market's support at that price range had significantly strengthened.
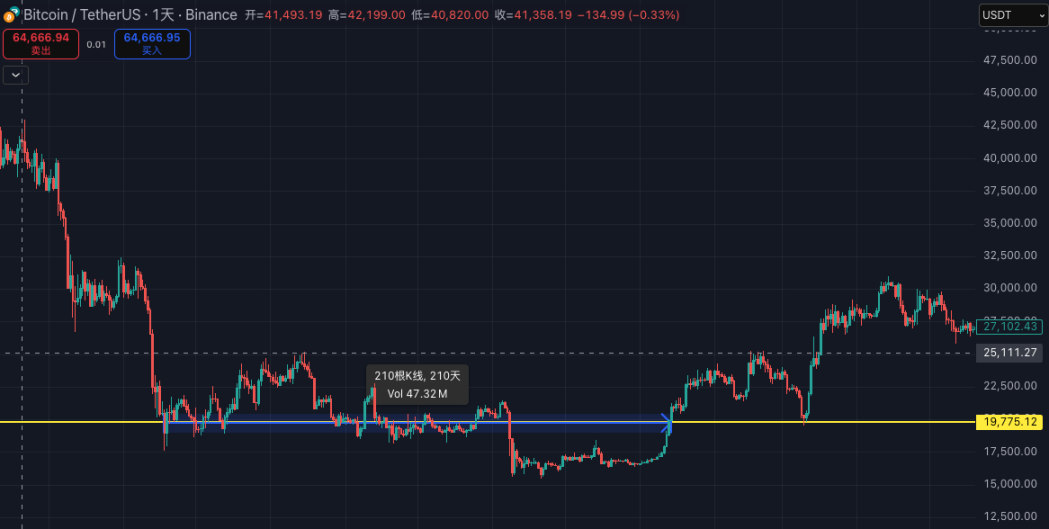
It can be argued that the market completed the core chip turnover and pressure testing of this bear market in the area below $17,000 to $20,000. The subsequent market trend entered a long, volume-declining bottoming recovery period. It wasn't until early 2023, with expectations of macro interest rate hikes slowing down and the market beginning to speculate on new narratives, that Bitcoin regained the $20,000 mark and initiated a new upward cycle. This occurred 210 days after it first broke below $20,000.
After breaking a key level, the market does not immediately find a bottom; it typically undergoes a long period of oscillation and failed rebounds, followed by deeper declines during credit shocks or liquidity events, ultimately forming a bottom in a lower range, which then takes months to over a year to recover and return to previous high ranges. This pattern is very typical in the path from 2022 to 2023.
Can We Buy the Dip? How to Buy the Dip?
If one attempts to "carve a boat to seek a sword," trying to buy the dip at the first opportunity is always risky. When a key, long-term support level is first broken, it usually signifies that a fierce panic sell-off has just begun, rather than ended. Although the price in June 2022 was tempting, the market's downward momentum was far from exhausted. The true bottom of a bear market is less about a precise price point and more about a long and grueling time period.
This bottoming area has distinct characteristics. After experiencing a sharp decline, the market enters a phase of continuously shrinking trading volume and narrowing price fluctuations. At that time, the market atmosphere shifts from initial panic to complete numbness and despair. There are no longer discussions of wealth myths on social media; instead, there is silence, and even the most steadfast holders begin to question their life choices. This period of market indifference, where no one pays attention, is often the most significant psychological characteristic of the bottom area.
True bottom confirmation often requires a final stress test, which is frequently marked by the collapse of some large institutions. The FTX collapse in November 2022 played such a role. When this industry giant fell, the market did dip again, but it did not create significantly lower lows than those from six months prior. When the market shows resistance to sufficiently damaging bad news, it is a high-confidence signal indicating that potential sellers have largely cleared out, and the market has completed the most thorough turnover. After this, although confidence recovers slowly, the space for further price declines is very limited, and a broad, solid bottom area is formed.
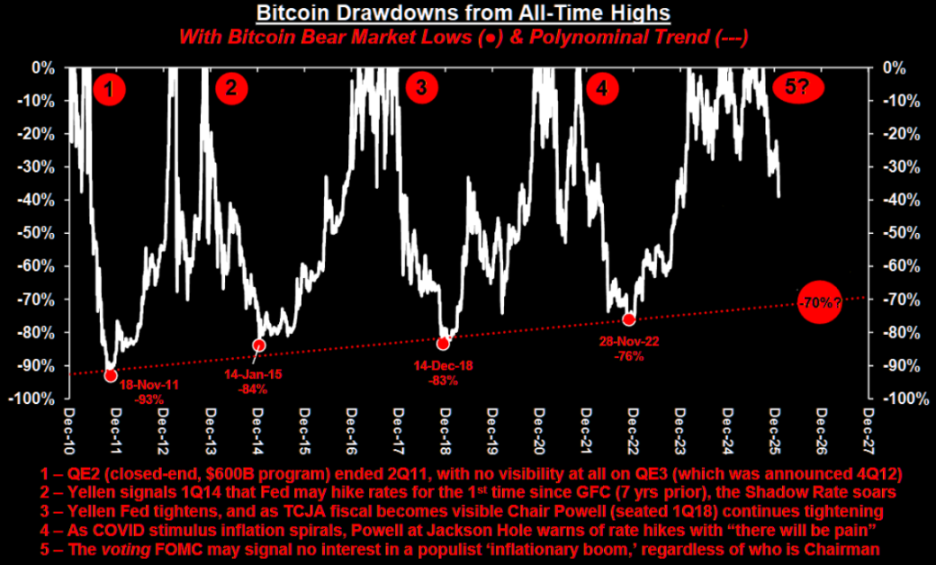
If we analyze the depth of the retracement from each historical high to the bear market low, the four marked lows correspond to approximately 93% retracement in 2011, 84% in 2015, 83% in 2018, and 76% in 2022. Visually, the deepest declines in bear markets are gradually converging. If this trend continues, it is estimated that the bottom of this bear market may be around a 70% retracement.
As for how to buy the dip, analyst Phyrex Ni provides a perspective from a human psychology angle. Phyrex suggests that one can determine the timing for buying Bitcoin by using the fear data VIX, which has been his long-standing strategy for buying the dip. Backtesting data shows that this method is effective, especially during times of extreme market sentiment.
The stages for buying the dip based on VIX are as follows:
- When VIX is at 20, it is generally in a normal fluctuation range.
- When VIX reaches 25, it has entered the early stages of panic. This may not be the best time to buy the dip, but it can be used as an observation point, especially for assets that have declined significantly.
- VIX > 25 occurs relatively infrequently, often during event-driven situations, such as the two instances in October and November 2025, one being a government shutdown and the other tariffs. Events often lead to rebounds. This stage can be considered for starting to build positions.
- VIX > 30 is rare and usually indicates extreme events, with a more pronounced fear effect on the market. This is often a time with a higher success rate for buying.
- VIX > 40 indicates that the market has begun to spread bearish sentiments. When this occurs, it is a good time to increase investments, as all backtesting data shows that investing in BTC in this range is very stable, but situations exceeding 40 are still quite rare.
- VIX > 50 is very rare; the last occurrence was in April 2025 during the U.S. adjustments, especially related to the tariff war with China. Historical backtesting data shows that when VIX exceeds 50, there is often a significant upward trend within a short time.
Phyrex states that the current VIX is 22.56, which falls into the observation zone. In this range, whether to buy or not is not a significant issue, and one can decide based on their own situation. However, exceeding 25 or 30 is indeed a more prudent timing, but occurrences above 30 have been infrequent in the past two to three years.
免责声明:本文章仅代表作者个人观点,不代表本平台的立场和观点。本文章仅供信息分享,不构成对任何人的任何投资建议。用户与作者之间的任何争议,与本平台无关。如网页中刊载的文章或图片涉及侵权,请提供相关的权利证明和身份证明发送邮件到support@aicoin.com,本平台相关工作人员将会进行核查。