At the end of this content, I will share my views on short-term trends at the hourly level and how to layout short positions in the current phase. Before that, let's conduct a systematic analysis from the perspective of Bitcoin's long cycle.
I. Historical Patterns of Bitcoin's Bull and Bear Cycles
First, let's review Bitcoin's performance in the past few bull and bear cycles.
From historical data, Bitcoin's bull markets generally exhibit a relatively stable rhythm:
- Bull market upcycle lasts about 4 years
- Bear market correction lasts about 1 year
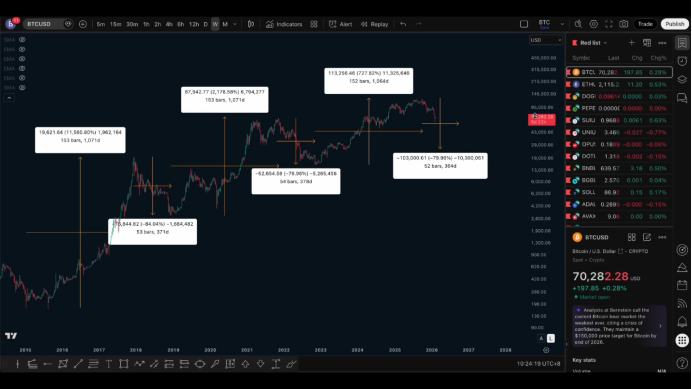
In the past three bull markets, each bull market's upward duration has basically maintained between 1,000 days to 1,100 days, which is roughly 4 years. The current bull market is similar, with an upward duration of about 1,050 days to 1,064 days, peaking in October last year.
In fact, I had already indicated last October that 126,000 could basically be seen as a phase top, a judgment that also referenced the historical pattern of Bitcoin's 4-year bull market cycle. From the results, the price indeed peaked in October last year and entered the current correction phase, which is the bear market cycle we are in now.
II. How Long Might This Bear Market Last
Next, let's look at the performance of the past two bear markets.
Historically, Bitcoin's bear markets have lasted about 1 year, slightly more but not significantly different. If we extrapolate based on this pattern, this bear market is likely to last until around October this year, which is near the end of the year.
This means that this year is very likely to be the year when Bitcoin builds a bottom and finds a bottom during this decline.
I personally believe that this bear market is unlikely to drag on until 2027; it is highly probable that the bottom will be established by 2026.
From a timing perspective, this bottoming time can only be earlier, not later. Even if it is earlier, it is unlikely to complete the bottoming process before June. Therefore, in my view, it is more likely to see a truly meaningful bottom area at least after June.
III. Timing Thoughts for Spot Layout
For investors who are more aggressive and hope to lay out spot positions at lower levels, I personally prefer:
- To start considering after mid-year this year
- As we enter the second half of this year, gradually and in batches conduct spot buying
From a timing dimension, gradually dollar-cost averaging into spot positions in the second half of this year is a relatively reasonable choice.
Even if one does not deliberately pursue buying at the lowest point, as long as they continue to lay out within this time frame, from a long-term return perspective, the price is still within a relatively reasonable range.
In summary:
- The bear market is likely to find a bottom around October this year
- Time will only advance, not delay
- The bottom will definitely be established by 2026
- The best time window for spot buying is after June, especially in the second half of the year
IV. Estimating the Downward Space of This Bear Market
Next, let's analyze from the perspective of price magnitude.
We can observe a clear characteristic:
- The upward magnitude of the bull market is diminishing
- The downward magnitude of the bear market is also diminishing
In the past two bear markets:
- One had a decline of about 84%
- One had a decline of about 71%
Based on this diminishing pattern, I believe the decline in this bear market is more likely to fall between 60% and 70%.
On average, 65% is a relatively reasonable expected value.
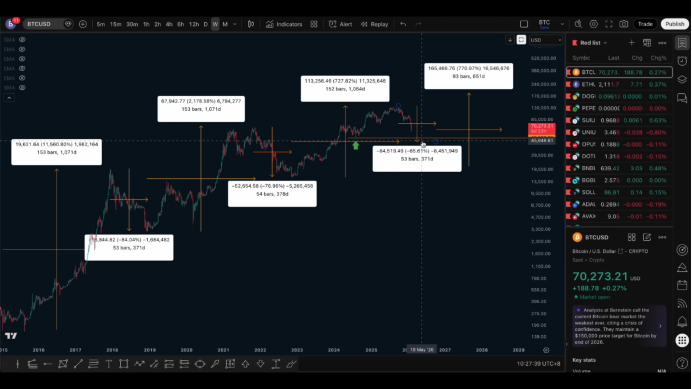
Structurally, a 65% retracement position corresponds exactly to the lower part of the previous important central structure. Once broken, it can lead to a thorough liquidation of high-position bulls, and the support below is relatively limited.
If we calculate based on a 65% retracement, the corresponding price is approximately around 45,000.
Therefore, from a price perspective:
- Below 50,000 is the relatively reasonable long-term buying range
- The more ideal area is around 45,000
Previously, I mentioned that the bottoming range for this round might be between 70,000 and 50,000, which was a broad judgment given last October. However, from the current downward pace, the speed of decline is noticeably fast, and the probability of falling below 50,000 is increasing.
V. Height Expectations for the Next Bull Market
If we assume that the next bull market will still maintain an upward cycle of about 4 years, then calculating from the completion of this round of bottoming, the peak time of the next bull market will roughly fall in 2030.
This also means:
- The spot positions established this year
- Should at least be held until 2029 to 2030
- Before considering gradual selling
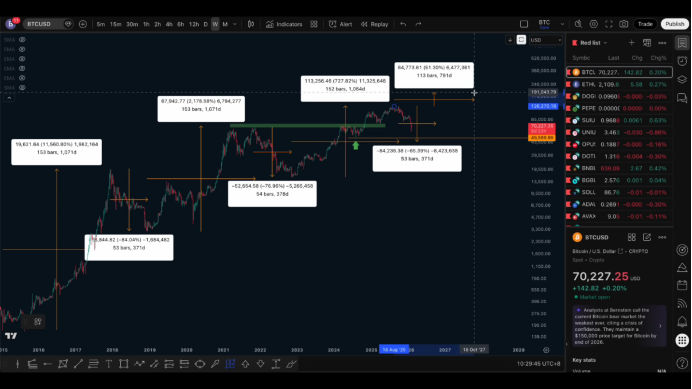
In terms of height, the next bull market's increase will also continue to diminish. The previous bull market completed about 80% of the expansion after breaking the previous high.
If the next bull market only does a 50% expansion, then the corresponding target price is approximately around 190,000.
Many people mention 300,000 or 400,000; I personally believe that this probability is not high. It is more likely to break the previous high and then undergo a relatively moderate expansion.
VI. Estimating Long-Term Return Rates
If the low point is at 45,000 and the high point is at 190,000, the overall return is about 4 times.
Corresponding to the 4-year cycle:
- Annualized about 100%
Even if halved, an annualized 50% still has high attractiveness.
Therefore, I believe that starting from 2027, Bitcoin may become a very cost-effective asset class, with significant advantages in medium to long-term allocation.
VII. Auxiliary Judgment with On-Chain Indicator NUPO
We have previously mentioned Glassnode's NUPO indicator multiple times, which represents the on-chain net unrealized profit and loss status.
This indicator is divided into four stages: red, orange, yellow, and green.
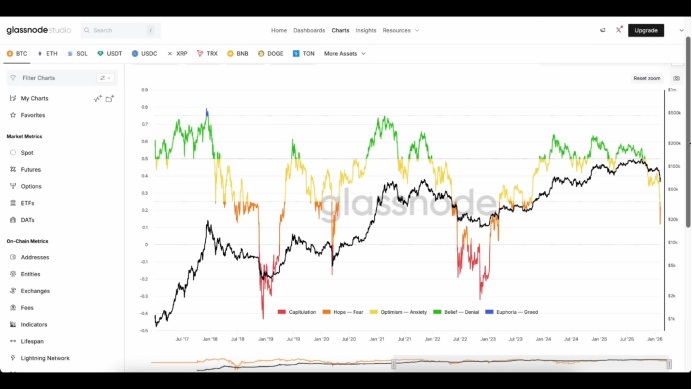
- Yellow: Wait-and-see stage
- Green: Phase top, consider selling
- Orange: Consider gradual dollar-cost averaging
- Red: More suitable for heavy positions to build a bottom position
The high point of 126,000 in this round corresponds exactly to the green stage of NUPO, and there was a divergence signal of price making new highs while the indicator weakened, which was an important basis for judging the top at that time.
Currently, NUPO has entered the orange stage. From historical experience, once it enters the orange stage, even if it cannot precisely determine the price bottom, one can consider participating through dollar-cost averaging.
Even if the future low point is at 45,000, and the orange stage appears around 60,000, from the perspective of long-term growth, it is still within a reasonable range.
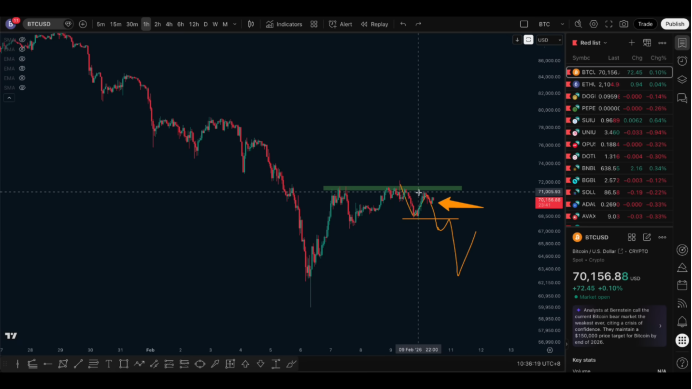
VIII. Short-Term Thoughts at the Hourly Level
Finally, returning to the short-term structure.
Currently, the market is consolidating at a high level, forming a top oscillation structure. Many people interpret this as a central area, but in my view, there is no clear independent long signal at this position.
After a rapid V-shaped rebound following a significant decline, the market often experiences another round of decline:
- Either breaking the previous low, forming a short-term bottom
- Or making a higher low before facing a larger decline
In either case, this rebound is insufficient to directly drive a trend reversal. Therefore, I prefer:
- Better to miss the bullish opportunity
- Rather than suggesting chasing long positions at high levels
IX. Current Short-Term Operation Conclusion
One point that can be confirmed currently is:
An effective resistance level has already formed above, and it has been tested multiple times without breaking through.
The highest point of this resistance level is at 72,000, so it can serve as a defensive level for shorts.
Currently, if short positions are laid out, it belongs to left-side trading, suitable for:
- Short positions
- Low leverage
- Strict risk control
The final operational thought is:
- Above 70,000, consider short positions
- Defensive level is above 72,000
- The target is to speculate on the next downward trend
Follow me, join the community, and let's improve together.

免责声明:本文章仅代表作者个人观点,不代表本平台的立场和观点。本文章仅供信息分享,不构成对任何人的任何投资建议。用户与作者之间的任何争议,与本平台无关。如网页中刊载的文章或图片涉及侵权,请提供相关的权利证明和身份证明发送邮件到support@aicoin.com,本平台相关工作人员将会进行核查。


