1. Multi-Period Technical Scenario Analysis
The current market is in a phase of micro-violent rebound under a macro downturn, with signals from various cycles nested and a complex structure, requiring dissection to clarify primary and secondary contradictions.
15-Minute Chart (Micro Disturbance): The good news is exhausted, and momentum has dwindled. Last night the CPI data triggered a momentary spike to $69,482, after which the price did not maintain strength but quickly fell back to around $69,000 for horizontal consolidation. The moving average system (MA5 and MA10) is flattened and intertwined, with a risk of a death cross forming in MACD at a high level, red momentum bars continuing to shrink, and RSI dropping from the overbought zone to around 70. This clearly indicates that the short-term desire to chase higher has weakened, with bulls entering a phase of consolidation, and there is a need for a retest to confirm support. The short-term resistance zone is focused between $69,200 and $69,400, while the initial support below is at the $68,500 level.
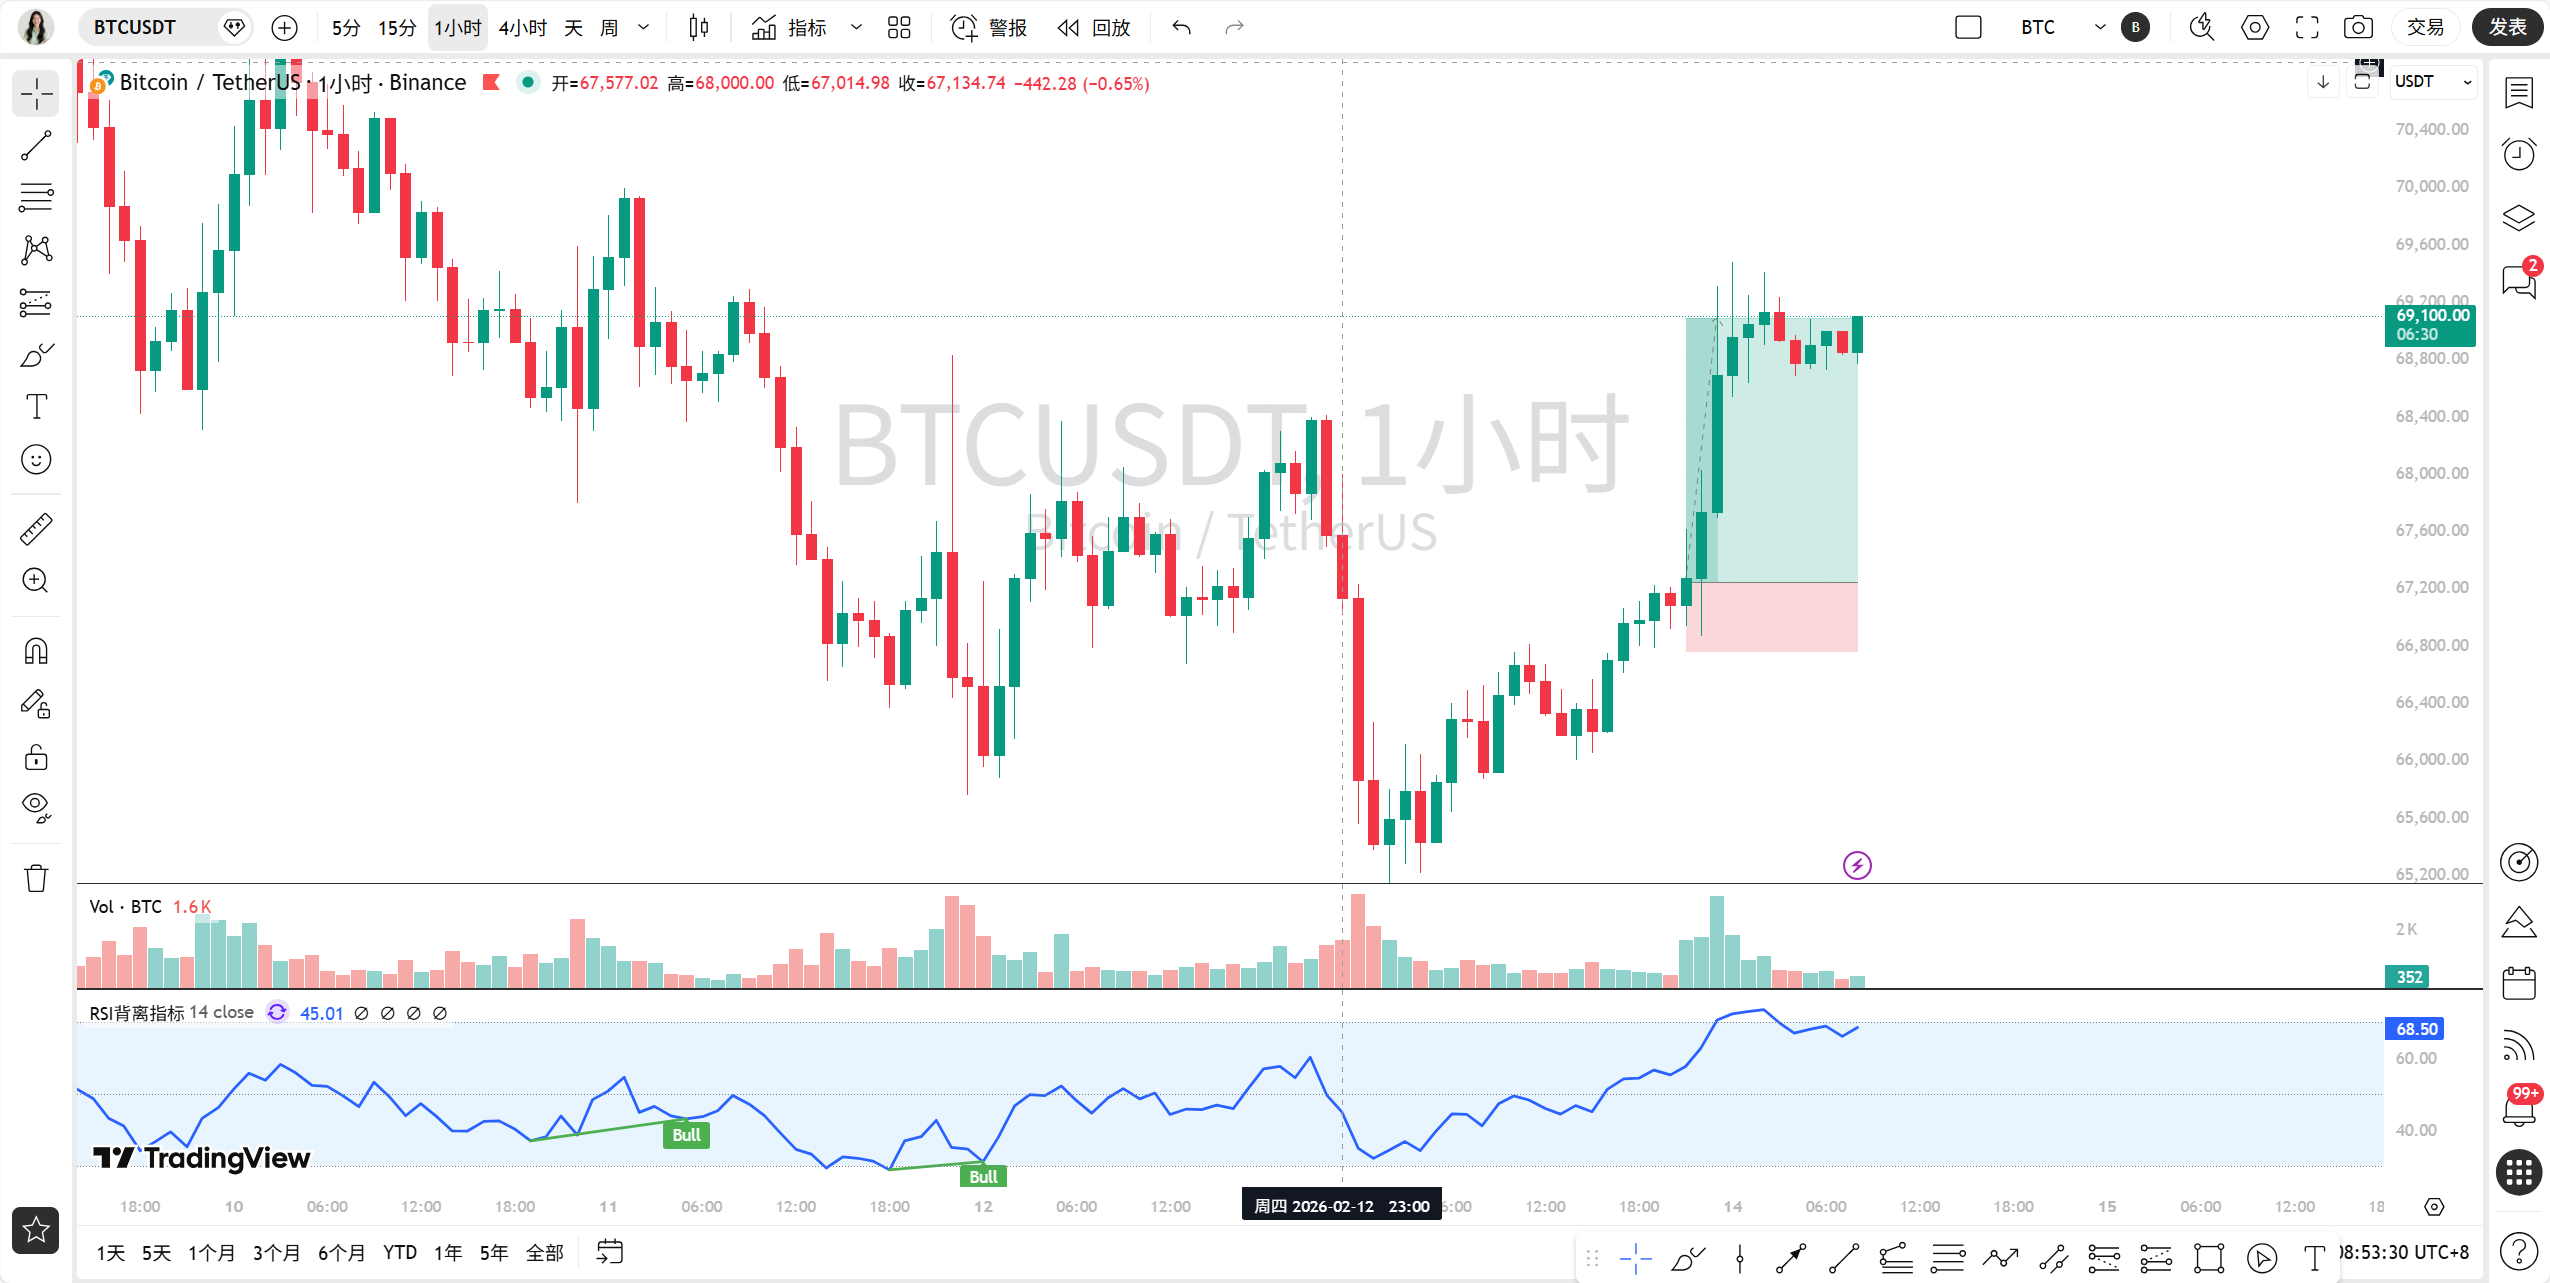
1-Hour Chart (Short-Term Game): The rebound structure is intact but needs consolidation. The V-shaped reversal pattern from the low of $65,118 remains in good condition, with moving averages still showing a bullish arrangement. However, it is worth noting that the price has slightly fallen below MA5, and the red columns in MACD continue to shorten, indicating a phase of exhaustion in upward momentum. Currently, the price is operating above MA10 (approximately $68,000), which serves as the first defense line for short-term bulls. If this position is lost, the adjustment will seek support at MA20 (approximately $67,200) and the upward trend line. The clear resistance levels are at the previous high of $69,400 and the psychological level of $70,000.
4-Hour Chart (Mid-Term Trend): Downward resistance; rebound encounters bottlenecks. The core technical basis for this rebound lies in the golden cross formed by MACD below the zero axis, and the momentum bars continue to expand, signaling the end of the previous one-sided decline. The price has already surpassed short-term moving averages but is facing pressure from MA20 (approximately $67,500). The current rebound appears more like a technical correction against the prior overselling, and its sustainability will face stern tests in the densely traded area between $69,500 and $70,000. If this area cannot be effectively broken through, the rebound structure may falter.
Daily Chart (Long-Term Picture): Oversold rebound in a bear market structure. This is the macro context for understanding the current market. All major moving averages still reflect a standard bearish arrangement, with the MACD dual lines in a deep water zone below the zero axis, which is a typical characteristic of a bear market. The current rise is essentially a “deviation rate correction” after the price has distanced itself from the moving average system, resembling an oversold rebound. The daily MACD green columns have significantly shortened, which is a positive signal of weakening downward momentum, but it is far from trend reversal. The first important resistance above is at MA5 (approximately $67,974) and the integer level of $70,000.
2. Core Logic and Key Variables
Driving Factor (Already Priced In): The U.S. CPI data being lower than expected was the trigger for the rebound, and this news has been fully digested by the market through last night's violent spike.
Market Structure: Last night's spike was accompanied by a massive short squeeze (around $349 million), which is a typical "squeeze" situation, rather than a sustained rise driven by proactive buying. The fragility of this structure lies in the fact that once upward movement is blocked, it is easy to trigger profit-taking among bulls. At the same time, information shows there are discrepancies on the institutional side, with newly increased addresses and large transfers of BTC to exchanges by institutions like BlackRock, indicating potential selling pressure above.
Potential Risks: At the macro level, the market's optimistic sentiment towards expectations of a Federal Reserve interest rate cut may be excessive, and any subsequent hawkish remarks could trigger a correction. At the micro level, rumors regarding USDT regulation and the loss operations of some major whales reflect that market confidence remains weak, and localized risks should not be overlooked.
3. Trading Strategies and Risk Management
Market Nature Assessment: Currently in a mid-term rebound phase within a long-term downtrend, with short-term exhibiting a consolidation after the good news has been exhausted. The core volatility range is expected between $67,000 - $69,500.
Strategy Recommendations:
Conservative Strategy (Left-Side Trading):
Since the price has reached a key resistance zone and the small cycle momentum is dwindling, the risk-reward ratio for chasing high in the short term is poor. It is recommended to abandon chasing and patiently wait for low buying opportunities after a pullback.
Ideal Long Zone A (First Pullback): Focus on the range of $68,000 - $68,200. If the price pulls back to this zone and stabilizes on the 1-hour chart (such as a long lower shadow, bullish engulfing pattern), you may attempt to establish a long position of 3% size.
Ideal Long Zone B (Deep Pullback): If $68,000 is lost, then wait for the range of $67,000 - $67,200 (4-hour MA10 and upward trend line resonance support). After a clear signal of stopping the decline appears, you may increase the position to 5% size.
Stop Loss Setting: Uniformly set below $66,800.
Target Price Levels: First target $69,000, second target $69,500 - $69,800.
Aggressive Strategy (Right-Side Trading):
The current range of $69,200 - $69,500 is the dual resistance of the overnight high and the high from 4 hours ago, which can be viewed as a potential opportunity for short-term short positions.
Entry Zone: The rebound to the range of $69,300 - $69,500, and the appearance of a stagnation signal on the 15-minute chart (such as shooting star, RSI divergence).
Position: Strictly control a position size of 1%, only as a test position.
Stop Loss Setting: Exit if there is an effective breakout above $69,800.
Target Price Levels: First target $68,500, second target $68,000.
Trend Reversal Confirmation Point:
Only when the price effectively stands above the integer level of $70,000 with increasing volume can it be considered that the mid-term downward structure has been broken, at which point one can turn to a more positive bullish outlook, aiming for the $72,000 area.
Risk Control Summary:
The market is always trading the gap between "expectations" and "reality." The favorable expectations brought by CPI have been realized, and the market returns to being dominated by technical aspects. In the current phase of intertwined long and short with a complex structure, it is essential to maintain flexible positions and focus on “buying the dip,” avoiding chasing highs at resistance levels. If the price breaks below the critical support of $67,000, then this rebound will be declared over, and one should decisively exit and observe.
For more quantitative disassembly of the impact of real-time news on market sentiment, updates have been made on my Qinglan Crypto Classroom, www.qinglan.org
免责声明:本文章仅代表作者个人观点,不代表本平台的立场和观点。本文章仅供信息分享,不构成对任何人的任何投资建议。用户与作者之间的任何争议,与本平台无关。如网页中刊载的文章或图片涉及侵权,请提供相关的权利证明和身份证明发送邮件到support@aicoin.com,本平台相关工作人员将会进行核查。


