First, let's look at the technical aspects:
15-minute chart (ultra-short term): The current price is hovering around 71200. After the sharp drop to below 70700 from last night to early this morning, there has been a minor level rebound. MA5 and MA10 are converging around 71000, the green bars in MACD are shortening, with the fast and slow lines showing signs of a golden cross below the zero axis, and RSI is hovering around 50. This indicates that the ultra-short term is in a fluctuating repair pattern, with fierce competition between bulls and bears at the 71000 position, and there is no clear direction for now.
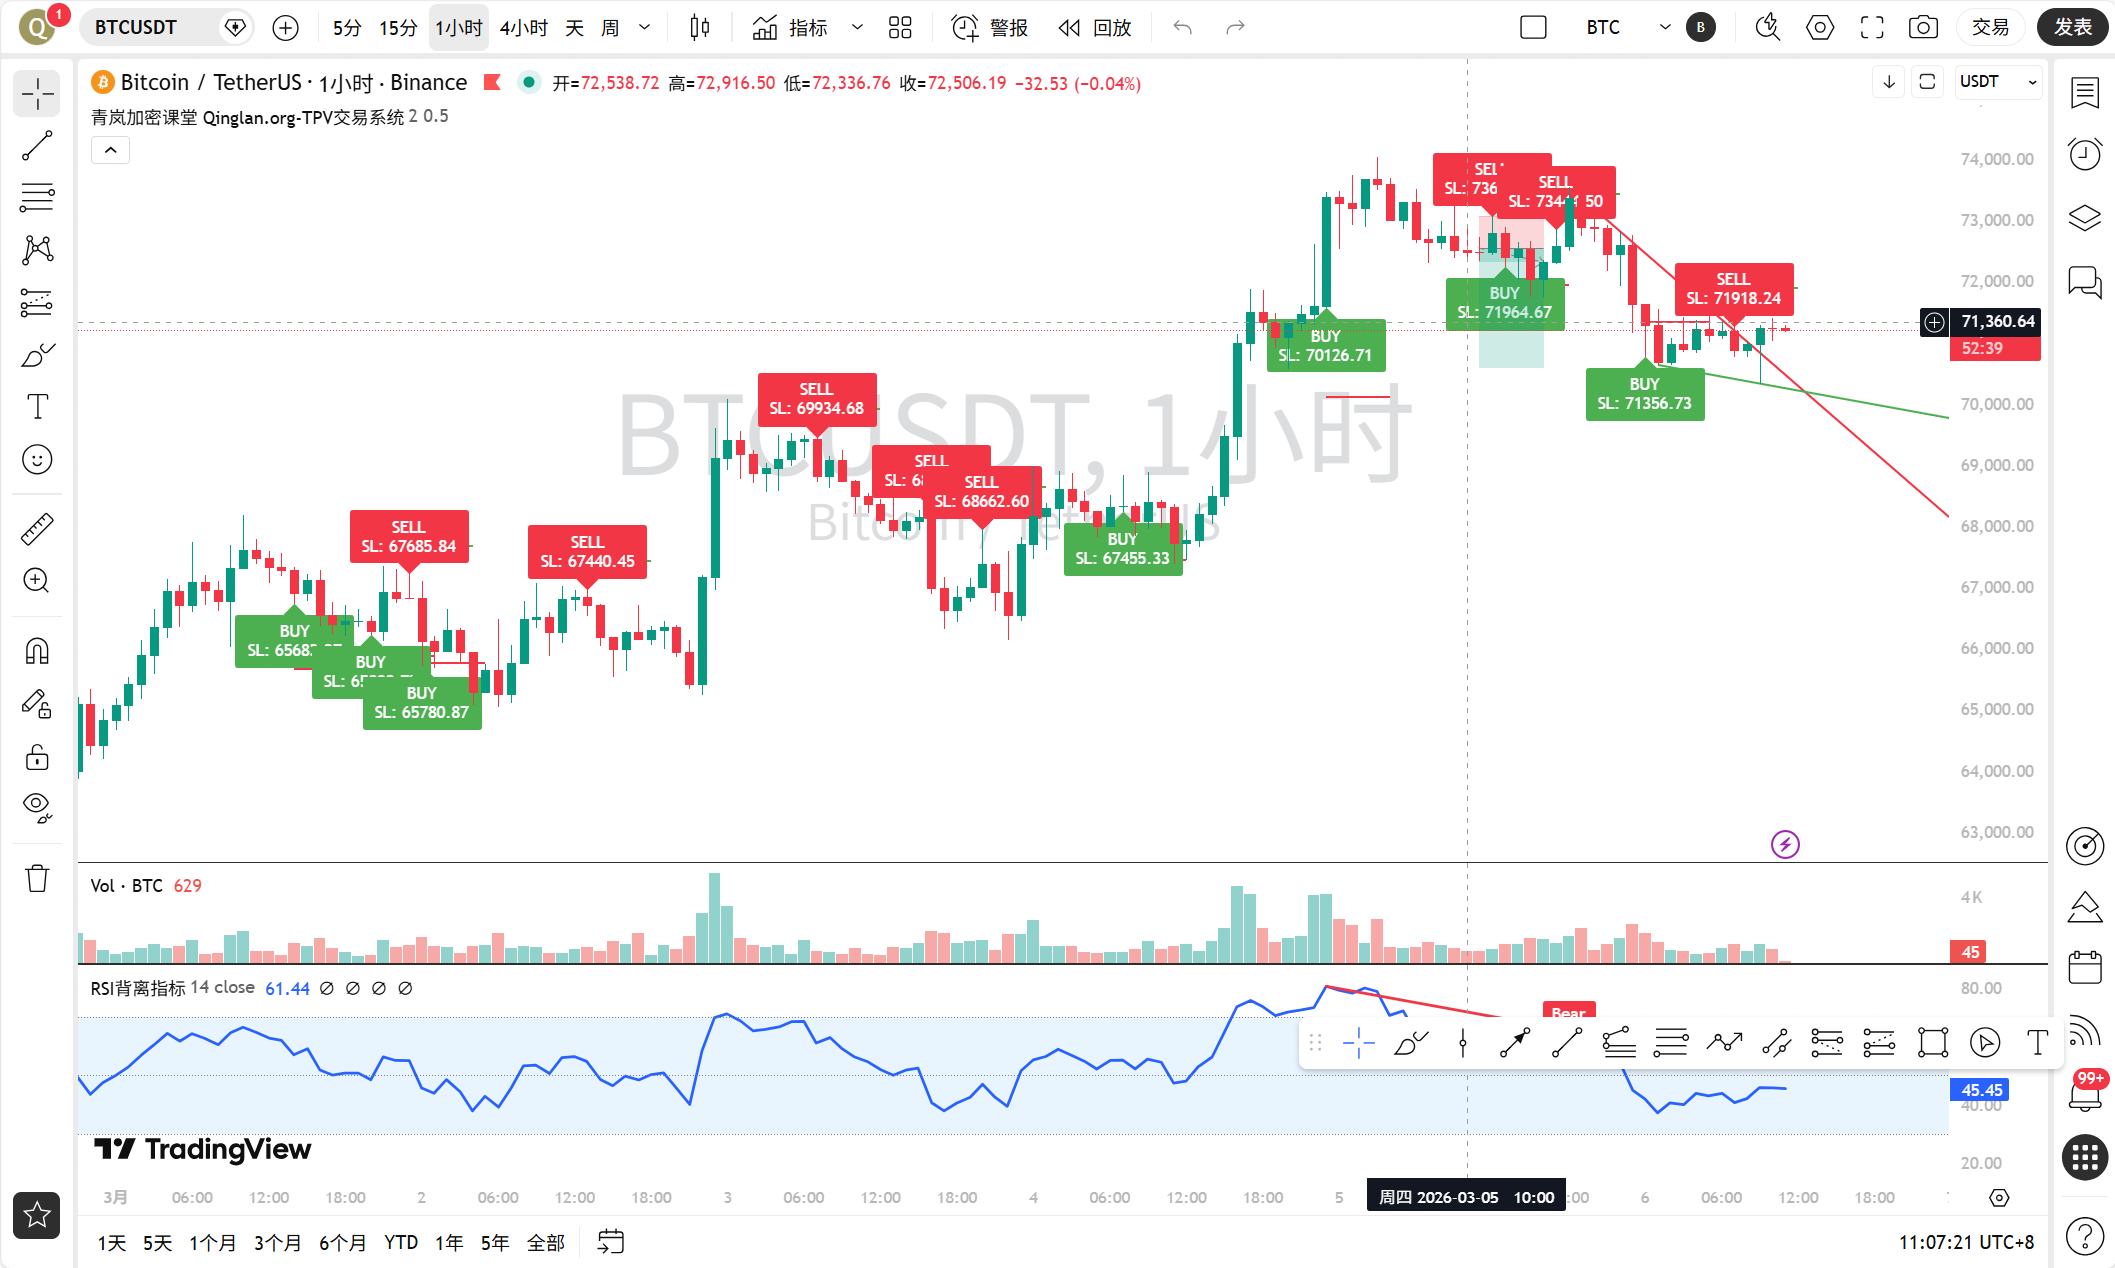
1-hour chart (short term): The trend is obviously weaker for bulls. The price is being pressed down by moving averages MA5, MA10, and MA20, forming a typical bearish arrangement. MACD is below the zero axis; although the green bars are shortening, the fast and slow lines remain deep underwater, with RSI around 45, not even able to rise above the midline of 50. The short-term trend is clearly bearish, and the rebound appears weak.
4-hour chart (medium term): This chart is the most critical! The price has broken below the lower perimeter of the previous upward channel and is currently fluctuating in the 71000-72000 area. MA20 (the medium-term lifeline) provides support around 70000, but the MA5 and MA10 above have already formed a dead cross and are diverging downwards. After the MACD formed a dead cross at a high position, the fast and slow lines are falling back towards the zero axis. Although the red bars have shortened, the adjustment trend remains unchanged. The medium-term trend has shifted from strong to weak, entering a phase of high-level fluctuation and correction.
Daily chart (long term): The overall pattern remains a bull market. The price is firmly above all major moving averages (MA5, MA10, MA20), and the long-term upward trend line is intact. The MACD is running at a high position above the zero axis; although the red bars have appeared, this is a normal adjustment following a significant rise. There are no issues with the long-term upward trend, and the current correction can be viewed as a consolidation and positioning exchange after a rise.
Key levels to remember:
Upper resistance: First look at 72000-72500, where there is a dense area of moving averages on the 1-hour chart and the lower edge of a previous small platform. Strong resistance is at 73500-74000, corresponding to the previous high and near the MA10 on the 4-hour chart.
Lower support: The nearest support is in the 70500-70000 range, which corresponds to recent low points tested multiple times, and the approximate positions of the 4-hour MA20 and daily MA5. Strong support is at 68000-68500, which is the previous breakout platform and the area of the daily MA10.
News is adding fuel to the fire:
News has been quite lively, with a mix of bullish and bearish signals. Positive factors include BlackRock CEO advocating for asset tokenization, IBIT seeing continuous large net inflows, and OKX receiving significant investment from ICE, all of which are long-term favorable. However, there are also glaring negative factors: A $52 million BTC long position on Hyperliquid is on the verge of being liquidated (just a few hundred dollars away!), resembling the sword of Damocles hanging over, intensifying market panic and short-term selling pressure. Additionally, escalations in Middle Eastern geopolitical conflicts (U.S. and Iran) and simultaneous declines in U.S. stock concept stocks have brought about macro-level risk-averse sentiment. These news pieces explain why the technical aspects have weakened, particularly the risk of that massive position being liquidated, which is the most direct "ticking time bomb" currently suppressing prices.
Overall prediction and trading thoughts:
Alright, let's tie all the above information together. The long-term bull market foundation remains intact, but the medium term (4-hour level) has entered an adjustment phase, while the short term (1-hour and below) is under pressure from negative news, exhibiting weak fluctuations.
Prediction: The market is digesting the risk of whale long position liquidation and macro negative news. It is highly likely to continue fluctuating in the 70500 - 72500 range to grind the bottom. If the whales are indeed liquidated, it could instantly create a "panic pit," but it might quickly be supported by strong buying from below (institutional inflows, long-term believers), forming a short-term bottom. A direct V-shaped reversal with a strong pullback is relatively difficult; it is more likely to exchange space for time, using fluctuations to digest the selling pressure.
Trading thoughts:
Short-term traders (bearish-oriented): You can try shorting lightly when the price rebounds to the resistance zone of 72000-72500 and shows signs of upward fatigue (such as long upper shadows, RSI bearish divergence), with a stop-loss set above 73000, aiming for targets at 71000 and 70500. Remember to trade lightly and set a proper stop-loss; this is like licking blood from a blade.
Swing/mid-term traders (low long positioning): This is a more prudent approach. Do not chase the rise; patiently wait for a correction. Focus on two key areas: One is the support zone of 70500-70000; if it tests again without breaking down, you can gradually position long. The second is if there is a panic drop to the strong support area of 68000-68500, which would be a better golden pit opportunity. Set the stop-loss 500-1000 dollars below the support.
Spot long-term traders: Ignore short-term fluctuations; corrections in a bull market are opportunities to enter. You can buy in batches in the aforementioned support zones and hold onto the coins without moving.
Lastly, here is a trading quote for everyone:
“Markets are born in despair, rise in hesitation, and end in jubilation. The current fluctuations and panic may just be the calm before the next charge.” Stay calm, adhere to discipline, and we can live long in the market.
For more updates on the impact of real-time news on market sentiment, it has been updated in my Qinglan Crypto Classroom: www.qinglan.org
免责声明:本文章仅代表作者个人观点,不代表本平台的立场和观点。本文章仅供信息分享,不构成对任何人的任何投资建议。用户与作者之间的任何争议,与本平台无关。如网页中刊载的文章或图片涉及侵权,请提供相关的权利证明和身份证明发送邮件到support@aicoin.com,本平台相关工作人员将会进行核查。