Let's analyze step by step from the macro level to the micro level, and then incorporate the news!
Long-term trend (1-day K-line chart)
From the daily chart, our BTC has recently experienced a substantial pullback, with prices diving from a high point. However, although the current price (68223.79) has dropped below the short-term MA5 moving average (69646.66), it still firmly stands above the MA10 (68317.04) and MA20 (67668.63) mid to long-term moving averages, and these three moving averages are currently maintaining a bullish arrangement (MA5 > MA10 > MA20). What does this signify? It indicates that from a longer-term perspective, the long-term upward trend of BTC has not been completely destroyed; this wave appears to be a healthy correction, or we can say a "deep squat" in a bull market.
Next, looking at the MACD indicator, although both the DIF and DEA lines are below the zero axis, showing that the market is experiencing a decline, the DIF line has successfully crossed above the DEA line, forming a golden cross at the daily level, and the MACD histogram has also turned positive and is beginning to expand. This is a very positive signal, suggesting that the long-term downward momentum is waning and the market may be brewing a rebound. The RSI indicator is currently at 46.35, within a neutral area, also providing ample room for a rebound.
Therefore, from the daily level perspective, although we are in a pullback, the overall upward potential remains, and the signal for a bottom reversal has already appeared.
Medium-term trend (4-hour K-line chart)
Alright, let’s shorten the time frame and take a look at the 4-hour chart. The situation here is a bit more complex. After experiencing a strong rally, BTC also encountered a significant pullback. The current price (68223.79) has not only dropped below the MA5 but has also fallen below the MA10 and MA20. More critically, MA5 (68637.45), MA10 (69878.56), and MA20 (70630.21) have formed a clear bearish arrangement (MA5 < MA10 < MA20), indicating that in the medium term, the downtrend is quite apparent, with bearish forces in control.
The MACD indicator also confirms this. Although the DIF line is still a bit above the zero axis (37.684), it has already dropped far below the DEA line (766.9531), and the MACD histogram shows a significant negative value and is expanding. This indicates that the downward momentum at the 4-hour level is very strong, and any rebound in the short term may encounter significant pressure. The RSI is at 41.77, which is weakly neutral, not providing a clear oversold signal.
In summary, the 4-hour chart indicates that we are in a medium-term pullback phase, and any rebound could merely be a technical correction during the downward process.
Short-term trend (1-hour and 15-minute K-line charts)
Finally, let’s take a look at the market dynamics from the past few hours.
1-hour chart:
On the 1-hour chart, the price (68223.8) is also below all moving averages, representing an overall bearish arrangement. However, in a similar vein to the daily chart, the 1-hour MACD indicator has also produced a golden cross! The DIF line (-760.4481) has crossed above the DEA line (-778.6048) deep in negative territory, and the MACD histogram has turned positive. This usually signals a potential for a short-term rebound. The RSI at 31.16 is close to the oversold zone, also supporting expectations for a short-term rebound.
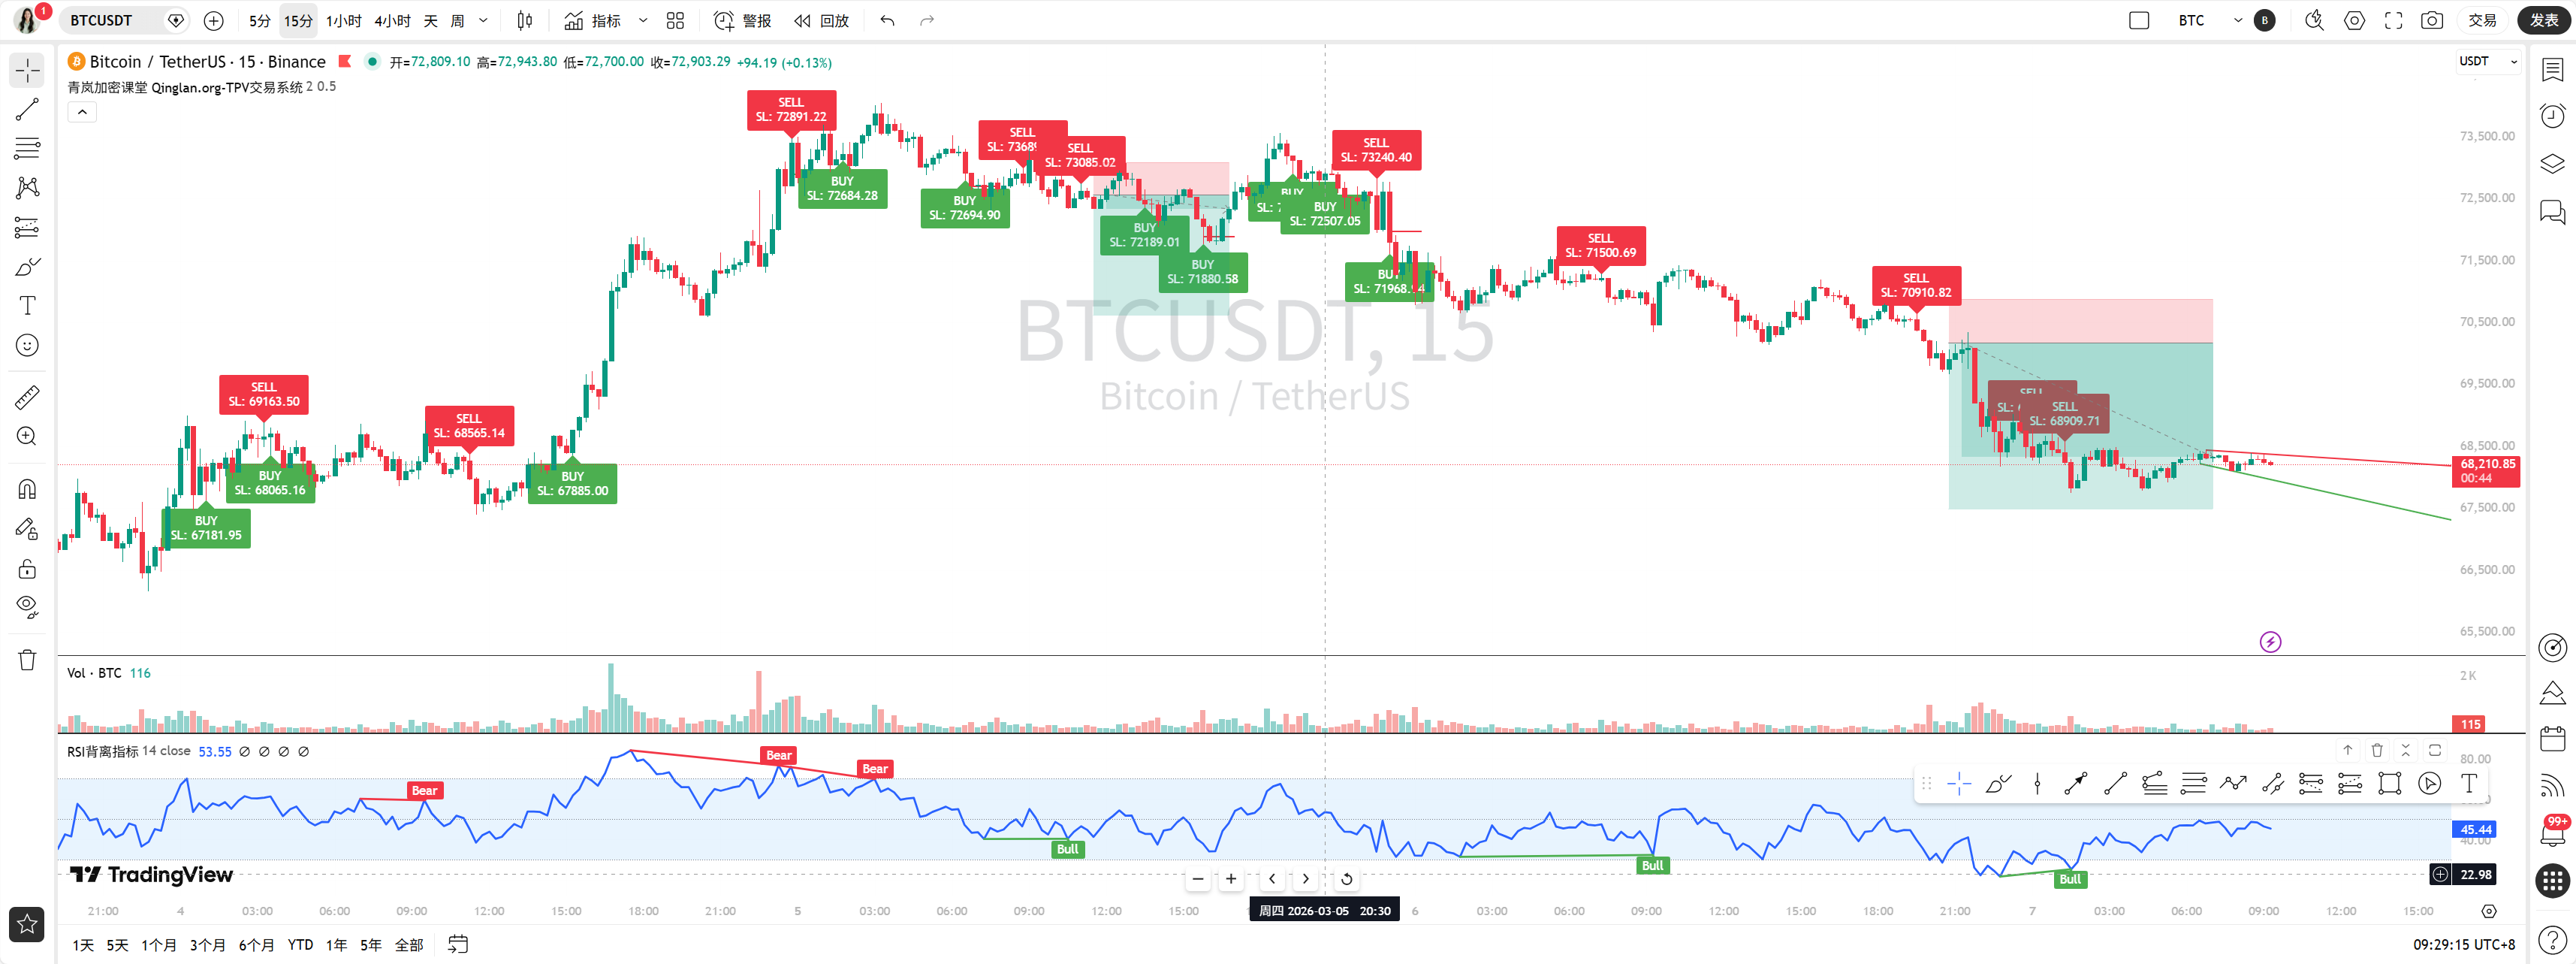
15-minute chart:
The 15-minute chart is the most volatile. Following a rapid decline, the price is currently consolidating at a low level. The latest MA5 (68252.5) has just managed to stay above both MA10 (68252.41) and MA20 (68228.9), creating a very weak short-term bullish arrangement. The MACD indicator has also provided a clear golden cross signal, with the DIF line crossing above the DEA in the negative zone, and the MACD histogram is positive with an expanding trend. The RSI at 45.93 has rebounded from the oversold zone, indicating some recovery in short-term market sentiment.
Therefore, in the short term, the market is attempting to stabilize after the decline, and the technical indicators are showing signs of a rebound.
Combining news and comprehensive judgment
When we combine these technical aspects with the previously observed news, it becomes clearer:
Current driving factors: We see that 【BTC has fallen below 68000 dollars】, 【ETF capital outflow】, 【Middle East situation pushing up oil prices】, and 【the dollar's safe-haven attributes are fully activated】, etc. These are very clear signals for risk aversion. The geopolitical tensions in the Middle East prompt global capital to flock to safe-haven assets like the dollar, leading to a sell-off in risky assets like cryptocurrencies. This is why we see significant declines on the 4-hour chart. The market's panic sentiment (VIX soaring) also corroborates this.
Future expectations: Don't forget that there is another very important piece of information in the news: 【Federal Reserve Governor Mester/Goolsbee: We should cut interest rates, with a possibility of starting to lower rates by the end of this year】, 【non-farm employment data disappointing, leading to a drop in US bond yields, with an increase in interest rate cut expectations】. Although weak employment data may bring short-term economic worries, it also strengthens future interest rate cut expectations from the Federal Reserve. Rate cuts mean liquidity easing, which is undoubtedly favorable for risk assets like Bitcoin in the long run.
Our judgment and trading ideas:
In summary, the current market is in a complex phase of a short-term consolidation rebound, a mid-term downward correction, and a long-term bull market pullback creating a bottom.
Short-term (15 minutes/1 hour): In the short term, our technical indicators have provided clear signals for a stop in the decline and a rebound (multiple cycles of MACD golden crosses, RSI warming up). After experiencing panic selling due to geopolitical factors, it is highly probable that a technical rebound will occur in the short term.
Trading idea: Short-term traders might consider looking for short-long opportunities around 68100-68200. For resistance above, pay attention to 68450-68500. If it can hold steady, the next target would be aimed at 69000-69200 or even 69500. But please note, this is merely a technical rebound in the downward process; be quick in and out, and strictly stop loss, as the overall environment is still bearish.
Reversal pattern: Currently, after the decline, the 15-minute chart is undergoing low-level consolidation. If it can effectively break through the densely packed short-term moving averages and continue to rise with volume, it could evolve into a small-scale V-shaped reversal or double bottom pattern.
Medium-term (4 hours): The medium-term trend remains bearish; any short-term rebound may encounter selling pressure at the mid-term resistance levels.
Key resistance: Focus on the range of 69800-70600 (where the 4-hour MA10 and MA20 are located); this will be the crucial watershed for whether the medium-term downtrend can continue. If the rebound encounters resistance here, it may continue to dive.
Trading idea: Medium-term traders can consider placing short positions if a rebound reaches the aforementioned resistance levels, especially if there is a slowdown in growth or a clear bearish signal, with stop-loss placed above the previous high.
Long-term (1-day): Despite having pullback pressures in the short and medium terms, the bullish arrangement of MA at the daily level and the MACD golden cross, as well as the Federal Reserve's expectations for interest rate cuts, have given a solid boost to long-term bulls.
Key support: The key support at the daily level is at 67600 (daily MA20); if it can hold above this level, the long-term bullish structure remains intact. A more critical psychological level is 65000.
Trading idea: Long-term investors can view this decline as an opportunity to build or add to their positions. Particularly when prices approach 67600 or even lower around 65000, combined with the news, this could be an excellent opportunity to establish long positions. However, it's essential to note that if geopolitical risks continue to escalate, it may lead to deeper cleansing, so building positions in batches is key.
Overall, we are currently facing a market where macro factors (interest rate cut expectations) conflict with short-term geopolitical risks. Short-term demand for a rebound exists, but the medium-term downtrend remains unchanged, requiring cautious operations. Long-term opportunities may be nurtured during the pullback.
Trading aphorism: "The market is like the tide, sometimes turbulent, and at other times fraught with undercurrents. We do not predict the direction of the tide but learn to navigate it, acting according to the situation to ride the waves."
For more quantitative dissection of real-time news impacts on market sentiment, it has been updated on my Qinglan Crypto Class: www.qinglan.org
免责声明:本文章仅代表作者个人观点,不代表本平台的立场和观点。本文章仅供信息分享,不构成对任何人的任何投资建议。用户与作者之间的任何争议,与本平台无关。如网页中刊载的文章或图片涉及侵权,请提供相关的权利证明和身份证明发送邮件到support@aicoin.com,本平台相关工作人员将会进行核查。