Coin Circle Liying: Bitcoin (BTC) Latest Market Analysis
Article published on 2026.3.9-----00:20
Current Bitcoin price is 67200. Liying predicts that after a large increase in trading volume on the daily chart, the market has entered a correction phase, with several consecutive days of bearish closes, indicating that short-term bearish forces are dominant. The current price has fallen below several recent support levels. The 2-hour candlestick chart shows a clear downtrend with bearish candles predominant at a recent low. The overall trend of the 2-hour MACD still leans bearish, and the RSI on the 2-hour timeframe indicates strong bearish momentum; however, this also increases the possibility of a rebound in the short term. The 2-hour EMA has fallen below all short-term, medium-term, and long-term moving averages, confirming a strong downtrend. The selling pressure on the daily chart may be exhausting, but further observation of volume changes is necessary to confirm a trend reversal. There is significant downward momentum in the 2-hour period,
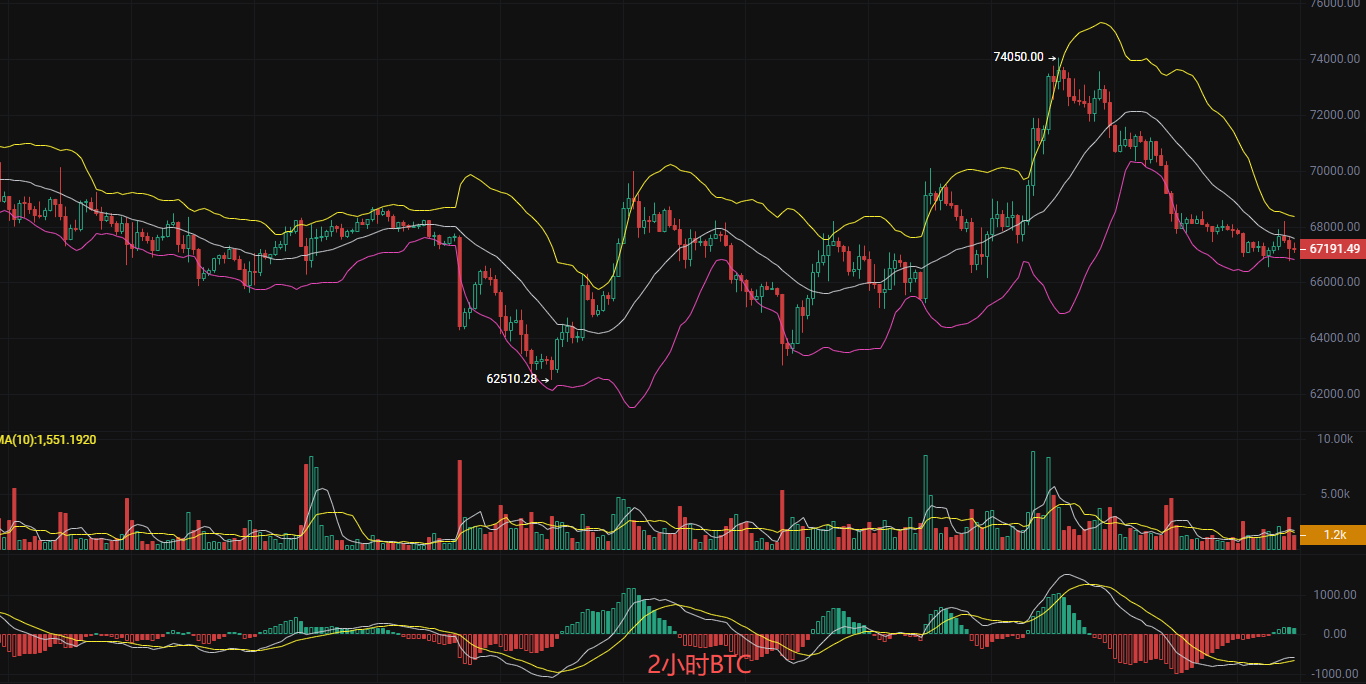
Short-term Reference:
For going long at 66000 and 65500, exit if it falls below 64500, and target above 67000 aiming for 68500
For going short at 68000 and 68500, exit if it loses 69000, and target below 67000 aiming for 66000
Ethereum (ETH) Latest Market Analysis
Before publishing, the current price of Ethereum is 1940. Liying notes that the current candlestick formation shows a rapid rebound from the low of 1825 to 2051, but with a long upper shadow, indicating selling pressure above. The 2-hour candlestick chart shows signs of slight retracement at a high level, which may face pressure in the short term. The MACD on the daily chart has not completely reversed its bearish trend; the 2-hour chart has the potential to form a golden cross, but attention is needed on subsequent volume. The RSI on the daily chart is neutral; the 2-hour chart is approaching the overbought zone, and the 2-hour EMA shows valid short-term support but appears weak in the long term. The trading volume on the daily chart shows increasing divergence between bulls and bears, and the 2-hour observation sentiment increases, indicating that the market is still in a sideways slow decline phase during the day,
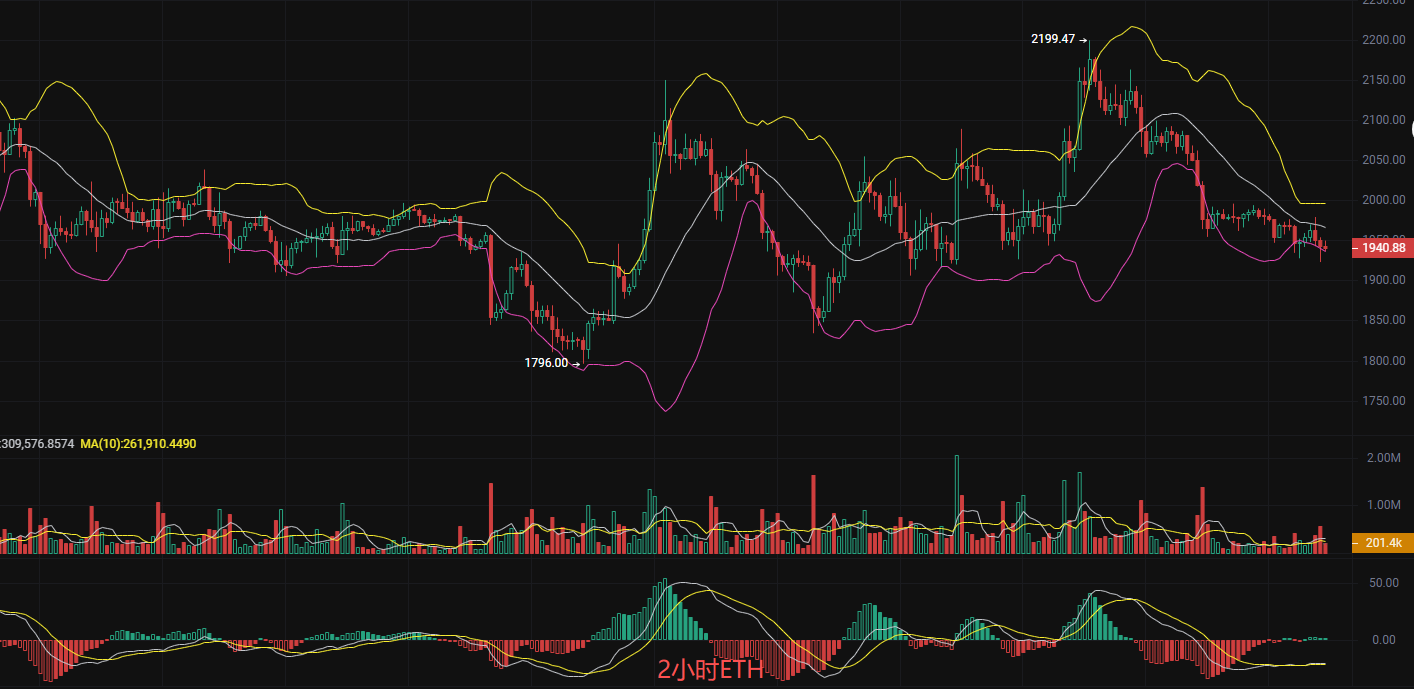
Strategy Reference:
For going long at 1900 and 1850, exit if it falls below 1800, and target above 2000 aiming for 2150
For going short at 2100 and 2150, exit if it loses 2200, and target below 2000 aiming for 1950
The above content is exclusively original by Liying, please indicate the source when reprinting! Article publication review has a time lag, and the market changes rapidly, the above suggestions are for reference only and risks are borne by the user. I hope Liying's insights will be helpful to you!

The content of the article is time-sensitive, for reference only, and risks are borne by the user
免责声明:本文章仅代表作者个人观点,不代表本平台的立场和观点。本文章仅供信息分享,不构成对任何人的任何投资建议。用户与作者之间的任何争议,与本平台无关。如网页中刊载的文章或图片涉及侵权,请提供相关的权利证明和身份证明发送邮件到support@aicoin.com,本平台相关工作人员将会进行核查。