Okay, let’s now blend the technical and news aspects of each cycle together.
First, let’s look at the big trend (daily & 4-hour):
On the daily chart, after BTC plummeted to around 60,000 USD in early February, it initiated a strong rebound. Currently, the price is firmly above all major moving averages (MA5, MA10, MA20), with the MACD below the zero line but the fast line (DIF) has already turned upwards, while the green bars continue to expand, indicating a clear signal of a slowdown in the medium to long-term downward trend and a bottoming rebound. The 4-hour chart is clearer; after a low on March 8, it has formed a standard "V-shaped" reversal, even peaking above 71,000 USD on the night of March 10. Although there has been a slight pullback, the overall structure is one of oscillating upwards. The key resistance level is in the prior high range of 73,000-74,000 USD, with strong support now moving up to 68,000 USD (which is also near the 4-hour MA20 moving average).
Next, let’s look at the short to medium term momentum (1-hour & 15-minute):
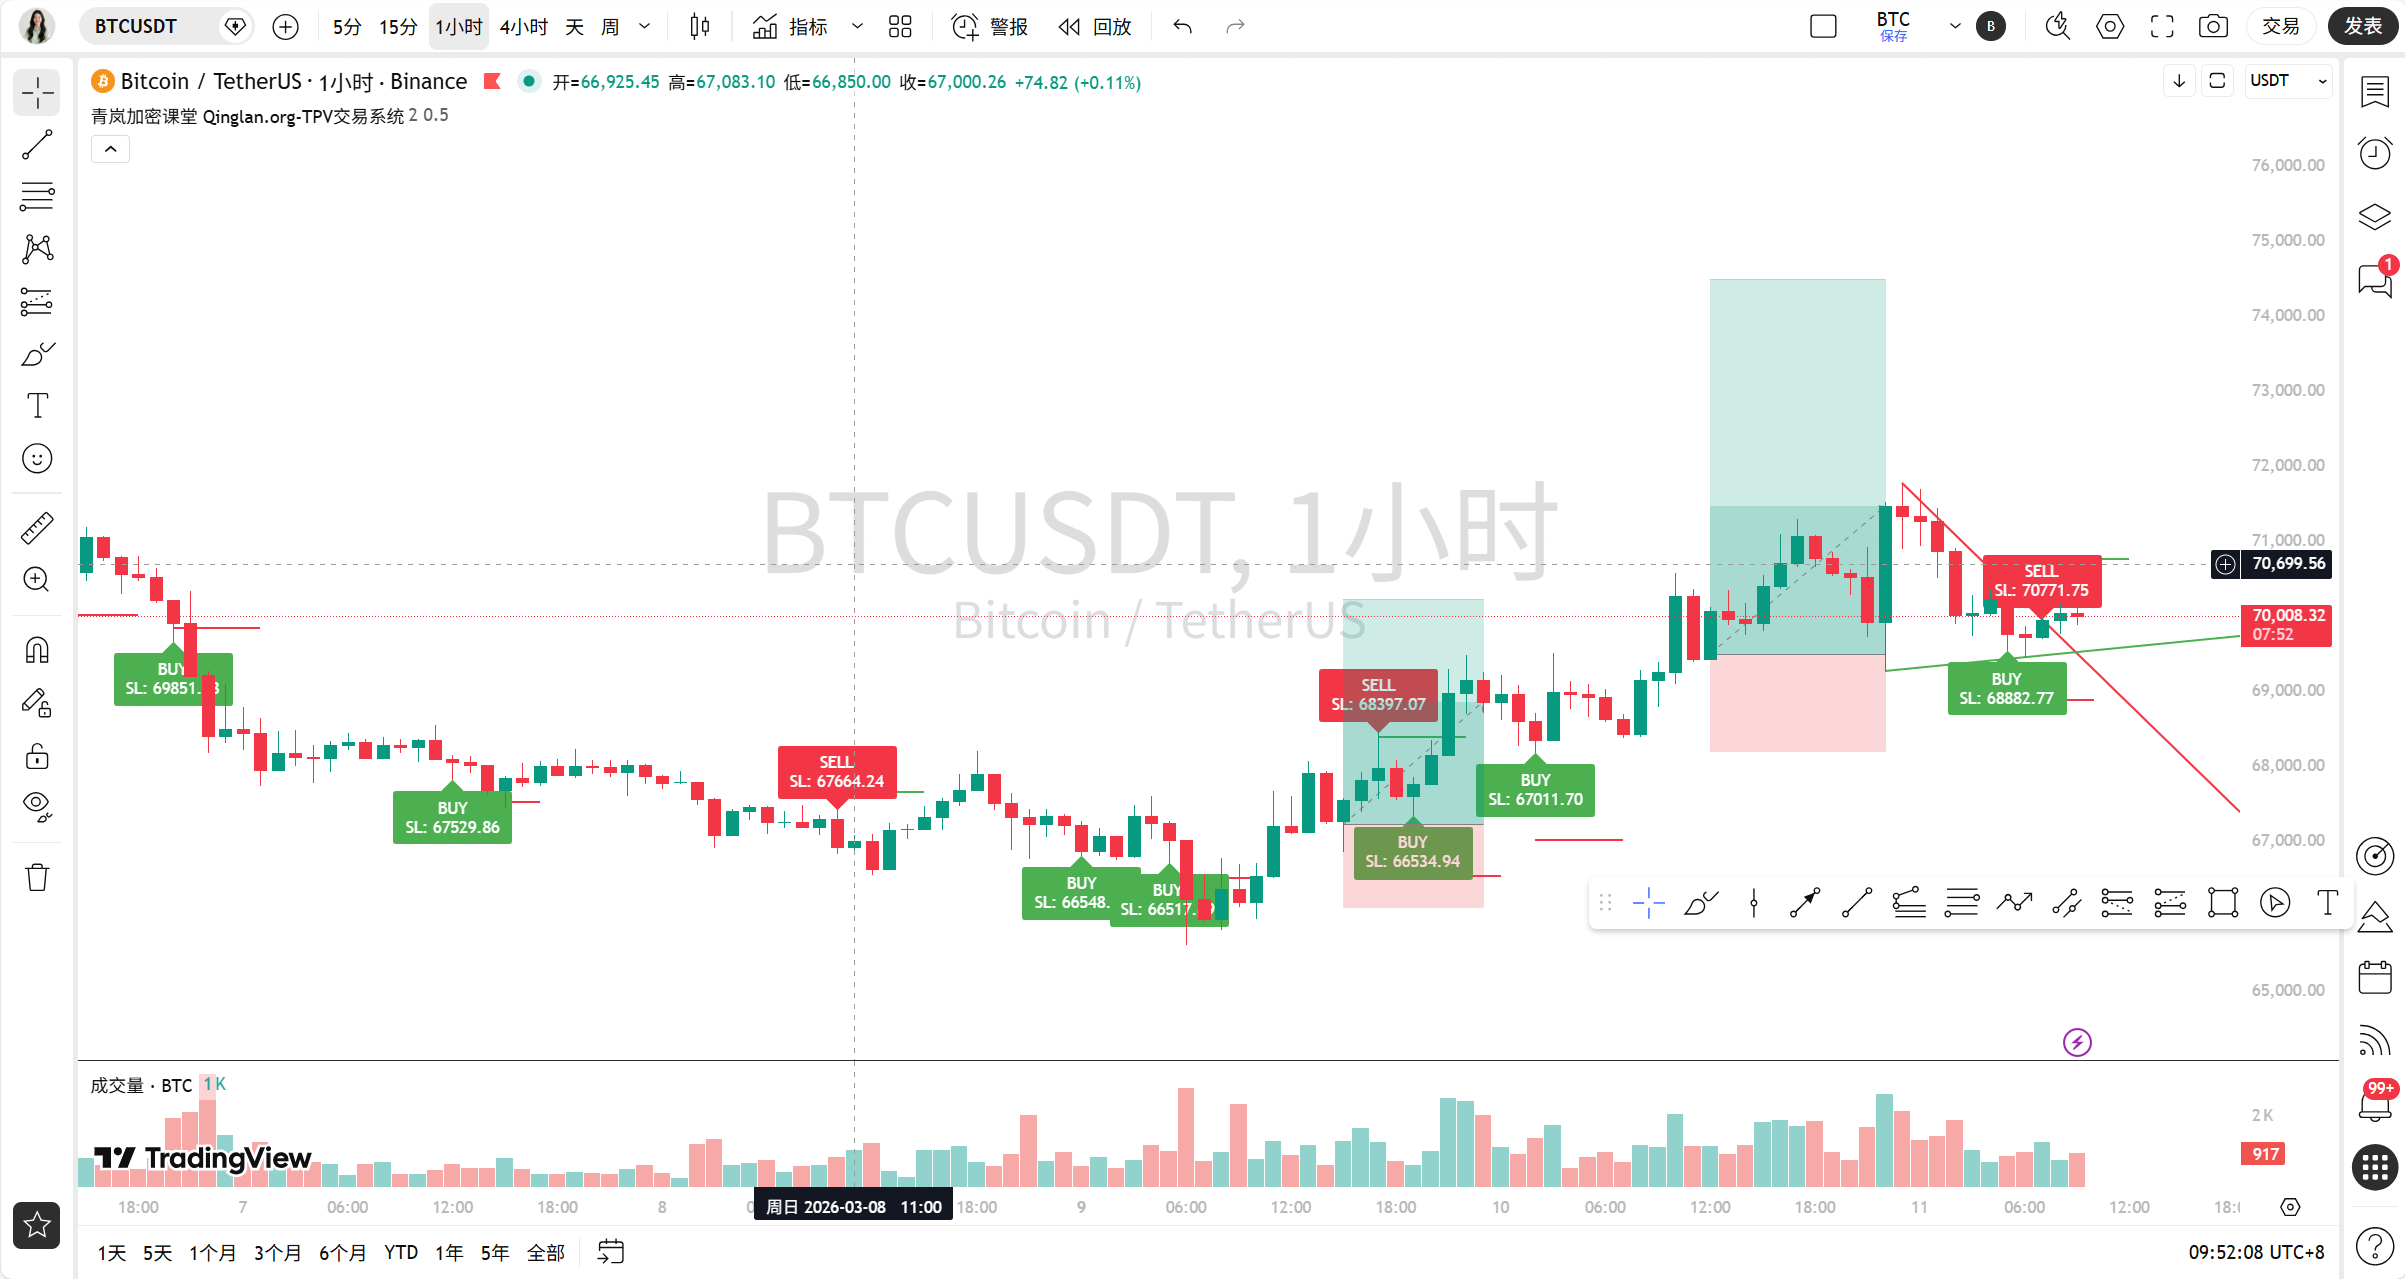
This gets interesting. The 1-hour chart shows that after breaking through 70,000 USD, there has been a clear tug-of-war between bulls and bears. The MACD fast and slow lines show a death cross above the zero line, red bars are beginning to appear, and the RSI has also retreated from the overbought area to the 50-60 balance zone, indicating a depletion of short-term upward momentum and a transition into a high-level oscillation. The 15-minute chart vividly showcases this "struggle": just look at that drop last night (March 10) from 71,000 USD rapidly down to 69,000, then the V-shaped rebound back above 71,000, with huge trading volume; this is a typical fierce exchange between bulls and bears. Currently, the 15-minute moving average system (MA5, MA10, MA20) is entangled with no clear direction, characteristic of typical range-bound oscillation, with a small range between 69,500 - 70,500 USD.
How do we interpret the news?
The news environment is intertwined with bulls and bears, but positive factors slightly outweigh the negatives. There are two key positives: first, BTC's strong breakthrough of 70,000 USD itself boosts market confidence; second, traditional markets are also warming up (with cryptocurrency-related stocks in the U.S. seeing a broad rise). The biggest potential negative is geopolitical risk (the U.S.-Iran conflict), but this has instead pushed gold prices sharply up, and to some extent, Bitcoin's "digital gold" attribute may be drawing some attention from certain funds. Tonight's U.S. February CPI data is crucial; if inflation data is mild, it will reinforce market expectations for the Fed to maintain an accommodative stance, which would be favorable for risk assets, including cryptocurrencies.
Comprehensive prediction and trading strategy:
Therefore, our prediction is that the medium to long-term trend is oscillating upwards, but the short-term faces adjustment pressure and is likely to trade sideways to gain space at high levels.
Based on this judgment, our trading strategy can be planned as follows:
Trend traders (medium to long-term): build long positions on dips. Do not chase high prices; patiently wait for a pullback. The ideal add position area is near the daily MA10 (around 68,500) and the 4-hour MA20 (around 68,000), both strong support levels. The stop-loss can be set below 67,000 USD.
Swing/short-term traders: sell high and buy low within the range. You can use the 70,500-71,000 USD area as resistance to attempt short positions, with the stop-loss above the previous high; at the same time, attempt long positions at the 69,500-69,800 USD support area, with the stop-loss below 69,000. Quick entries and exits to profit from the range movements.
Key observation point: closely monitor the market reaction after tonight's CPI data release. If the data is favorable, and the price breaks through the previous high resistance of 71,500 USD with increased volume, then the short-term adjustment may end, and a new upward movement may begin, at which point you can follow up with long positions.
Remember, before key data is released, market sentiment will be cautious, and volatility may increase; manage your positions well, avoiding heavily betting on direction.
Finally, I’ll leave you with a trading quote: “The trend is your friend, but oscillation is your examiner. Have the courage to hold positions in the trend, and have the patience to wait in oscillation.” See you next time!
For more quantitative analysis on how real-time news affects market sentiment, check out my Qinglan Crypto Classroom: www.qinglan.org
免责声明:本文章仅代表作者个人观点,不代表本平台的立场和观点。本文章仅供信息分享,不构成对任何人的任何投资建议。用户与作者之间的任何争议,与本平台无关。如网页中刊载的文章或图片涉及侵权,请提供相关的权利证明和身份证明发送邮件到support@aicoin.com,本平台相关工作人员将会进行核查。