Welcome to the Qinglan Crypto Class, I am Sister Qinglan. Let's get straight to the point:
Today we will continue to analyze from four timeframes, all genuine talk:
Step 1: Trend Determination
Let's start by looking at the big picture first.
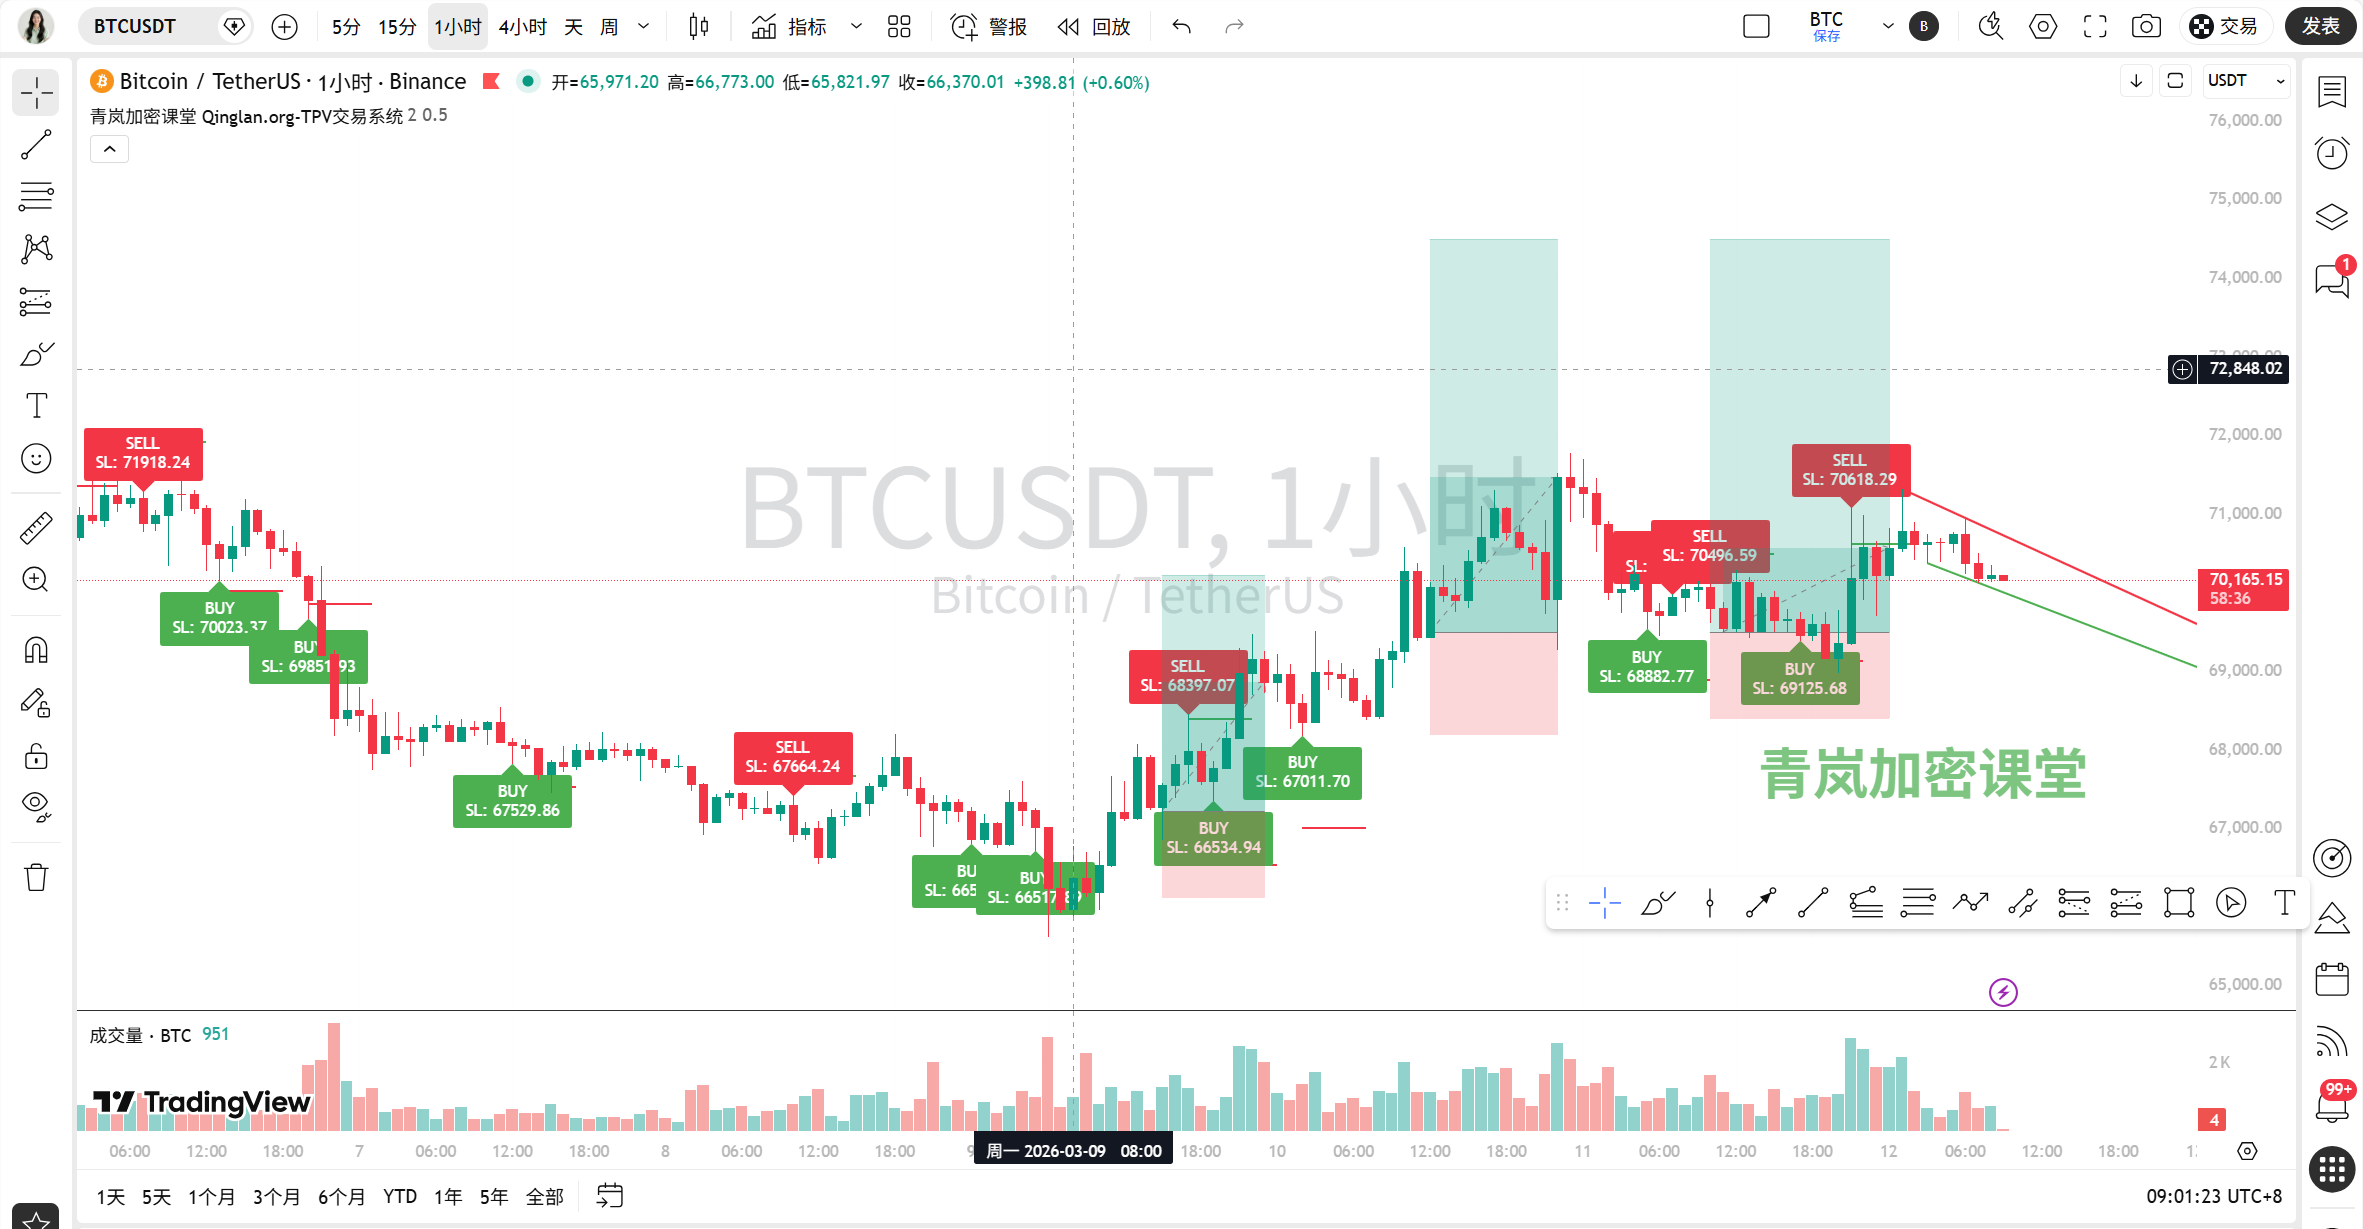
On the daily chart, the price is at 69974.5, and you can see that MA5, MA10, and MA30 are intertwined, which indicates that the long-term trend is choppy and has not yet chosen a direction. The key resistance is around 71000, which is the previous high, and support is around 68000. The on-chain data shows that the fear and greed index is only 15, indicating extreme fear! This suggests that market sentiment is very poor, but the price has not fallen, which we need to pay attention to; it may be in the process of bottoming out.
On the 4-hour chart, the price is at 69974.5, and the moving averages are also in an intertwined state, indicating that the medium-term trend is similarly choppy. Resistance is at 71000, and support is at 69000. The news mentions "Bitcoin maintains excessive loss realization status, when will market liquidity return?", explaining why the price can't rise, as there is a lack of new funds.
On the 1-hour chart, the price is at 69974.5, the moving averages are intertwined, and the short-term trend is also choppy. Resistance is at 70500, and support is at 69500. From the news, "US stocks diverge: oil stocks lead strong gains, cryptocurrency concept stocks pull back", indicating that external funds are losing interest in the crypto sector, suppressing short-term rebounds.
On the 15-minute chart, the price is at 69974.51, oh dear, MA5, MA10, and MA30 are in a bearish arrangement, indicating there is downward pressure in the ultra-short term. Resistance is at 70200, and support is at 69800. The on-chain sentiment is extremely fearful, combined with this bearish arrangement, indicating that there is still selling pressure in the short cycle.
Step 2: Key Level Identification and Reversal Patterns
On the daily chart, we should pay attention to a potential double bottom pattern, with the neckline around 71000. If it breaks through here, the rebounding space will be opened up. The news "VanEck partners with Basic Capital to include Bitcoin ETF in 401(k) retirement plans" is a long-term positive, potentially accumulating energy for future breakthroughs.
On the 4-hour chart, the price is oscillating around 70000, resembling a contracting triangle, with the upper and lower bounds at 71000 and 69000, respectively. The news "Federal Reserve Chairman Powell is under criminal investigation" introduces uncertainty, causing the price to fluctuate back and forth within this range.
On the 1-hour chart, no obvious reversal patterns have been seen for now, just fluctuations within a small range.
On the 15-minute chart, be careful, if the price falls below 69800, it may form a small descending channel and seek to explore lower levels. The news "A mysterious address withdraws 450 Bitcoin from Binance" could trigger following market actions in the short cycle.
Step 3: Technical Indicator Validation
The daily MACD shows a positive histogram of 679.12, but both DIF and DEA are far below the zero line, indicating signs of a bullish divergence! The price hasn't made a new low, but the bearish momentum is weakening. RSI is at 55.43, neutral but slightly weak, confirming the choppy movement.
The 4-hour MACD has a positive histogram of 68.81, and both DIF and DEA are above the zero line, but the histogram is shrinking, indicating that the upward momentum is weakening. RSI is at 56.16, also neutral, showing no direction.
The 1-hour MACD has a negative histogram of -34.04, with DIF and DEA on the zero line but preparing for a dead cross, leaning bearish in the short term. RSI is at 61.60, close to neutral, with no overbought or oversold conditions.
The 15-minute MACD shows all negative values, with a histogram of -50.66, indicating obvious bearish momentum. RSI is at 31.40, close to being oversold, suggesting that short-term declines may soon meet resistance. There aren’t any particularly significant volume spikes in on-chain trading, so these indicator signals are still considered reliable.
Step 4: Comprehensive Analysis of On-Chain and News Data
News Aspect:
Positive factors include: "US SEC and CFTC join forces to promote crypto regulation" (long-term positive for compliance), "VanEck partners with Basic Capital to include Bitcoin ETF in 401(k)" (introducing long-term capital), "Ripple launches $750 million share buyback" (shows industry confidence).
Negative factors include: "Federal Reserve Chairman Powell under criminal investigation" (increases macro uncertainty), "Cryptocurrency concept stocks pull back" (market risk appetite decreases), "FDIC Chairman clarifies: stablecoins have no deposit insurance" (a blow to the stablecoin sector).
These messages are intertwined, causing the price to fluctuate without a single directional drive.On-Chain Data:
The fear and greed index is 15, indicating extreme fear! This is very critical. Usually, this is a reverse indicator; when the market is in extreme panic, it is often not far from the bottom. However, price confirmation is needed. Total market capitalization and trading volume data have not shown specific changes, but from the news "Bitcoin maintains excessive loss realization status" it is clear that market liquidity is indeed tight. By combining the news and on-chain data, the market is in a state of "price oscillation but panic sentiment", which suggests that if favorable news appears, the rebound could be quite strong.
Step 5: Market Forecast and Trading Ideas
Current (within a few hours): In the ultra-short term, it is highly likely to continue oscillating within the small range of 69800-70200. The 15-minute bearish arrangement has downward pressure, but the RSI is close to oversold, limiting the downside space.
Today's key points and near-term perspectives: The most important support level today is 69500 (daily chart lower bound), and the resistance level is 70500 (the area where 1-hour and 4-hour moving averages are dense). If a volume breakout occurs above 70500, it could test the 71000 neckline; if it breaks below 69500, it may test the strong support at 69000.
Trading Ideas:
Opportunities in the Trend: Currently, the main trend is choppy, with no obvious single direction. You can try to go long with a light position when close to the support at 69500 and the 1-hour RSI is not oversold, targeting 70500. Or, if it rebounds to the resistance at 70500 and the 1-hour MACD confirms a dead cross, you can try to go short with a light position, targeting 69800.
Counter-Trend Opportunities: The daily bullish divergence and extreme fear index provide clues for medium to long-term counter-trend bullishness, but confirmation is needed for a price breakout above 71000; currently, counter-trend bottom fishing carries significant risks and is not recommended.
Wait and See: If the price remains unchanged between 69800-70200 and indicators are also unclear, then patiently wait for a directional choice.
Summary: The current core contradiction in the market is the divergence between extremely fearful sentiment and price stagnation, waiting for a catalyst to break the balance.
Trading Quote: Be greedy when others are fearful, but remember to wait for Mr. Market to give clear signals of greed before taking action!
That's it for today's analysis, see you next time!
More about the quantitative disassembly of how real-time news impacts market sentiment has been updated in my Qinglan Crypto Class: www.qinglan.org
免责声明:本文章仅代表作者个人观点,不代表本平台的立场和观点。本文章仅供信息分享,不构成对任何人的任何投资建议。用户与作者之间的任何争议,与本平台无关。如网页中刊载的文章或图片涉及侵权,请提供相关的权利证明和身份证明发送邮件到support@aicoin.com,本平台相关工作人员将会进行核查。