Written by: Maher, Foresight News
On March 11, the Consumer Price Index (CPI) report for February released by the U.S. Bureau of Labor Statistics showed that the seasonally adjusted CPI increased by 0.3% month-on-month and maintained a year-on-year increase of 2.4%, consistent with January; the core CPI rose 0.2% month-on-month and 2.5% year-on-year.
This is also consistent with the previous month. The energy index rebounded 0.5% month-on-month, with gasoline prices showing a monthly increase of 0.8%, yet a year-on-year decrease of 5.6%; the food index increased by 0.4% month-on-month, with a year-on-year increase of 3.1%; the housing component saw a year-on-year increase of 3.0% but only a monthly increase of 0.2%, indicating some relief in rental pressure and owner-equivalent rent.
This report largely met market expectations, with inflation remaining stagnant at the level of 2.4%, and the core indicators showing no significant signs of accelerating decline. Data collection for February ended at the end of the month, just before the first air strikes by the U.S. and Israel against Iran, thus it does not fully reflect the impact of subsequent energy price fluctuations. Several institutions have analyzed that if adjustments due to government shutdown data filling are excluded, the actual inflation might be close to 2.8%; conversely, if the effects of tariff transfers are excluded, it could fall to around 2.2%. However, in either case, inflation is still distant from the Federal Reserve's 2% target, especially as housing and service-related sticky components remain at high levels.
Morgan Stanley pointed out that the Federal Reserve may restart interest rate cuts as early as June, but the impact of oil price shocks triggered by the Iranian conflict could delay this process.
The bank's economists currently maintain their previous forecast, believing that the Federal Reserve will cut interest rates by 25 basis points in June and September—despite rising energy prices potentially intensifying inflationary pressure. However, they also believe that the Federal Reserve may delay the first rate cut until September or even December, and both of these scenarios could push the next rate cut back to 2027.
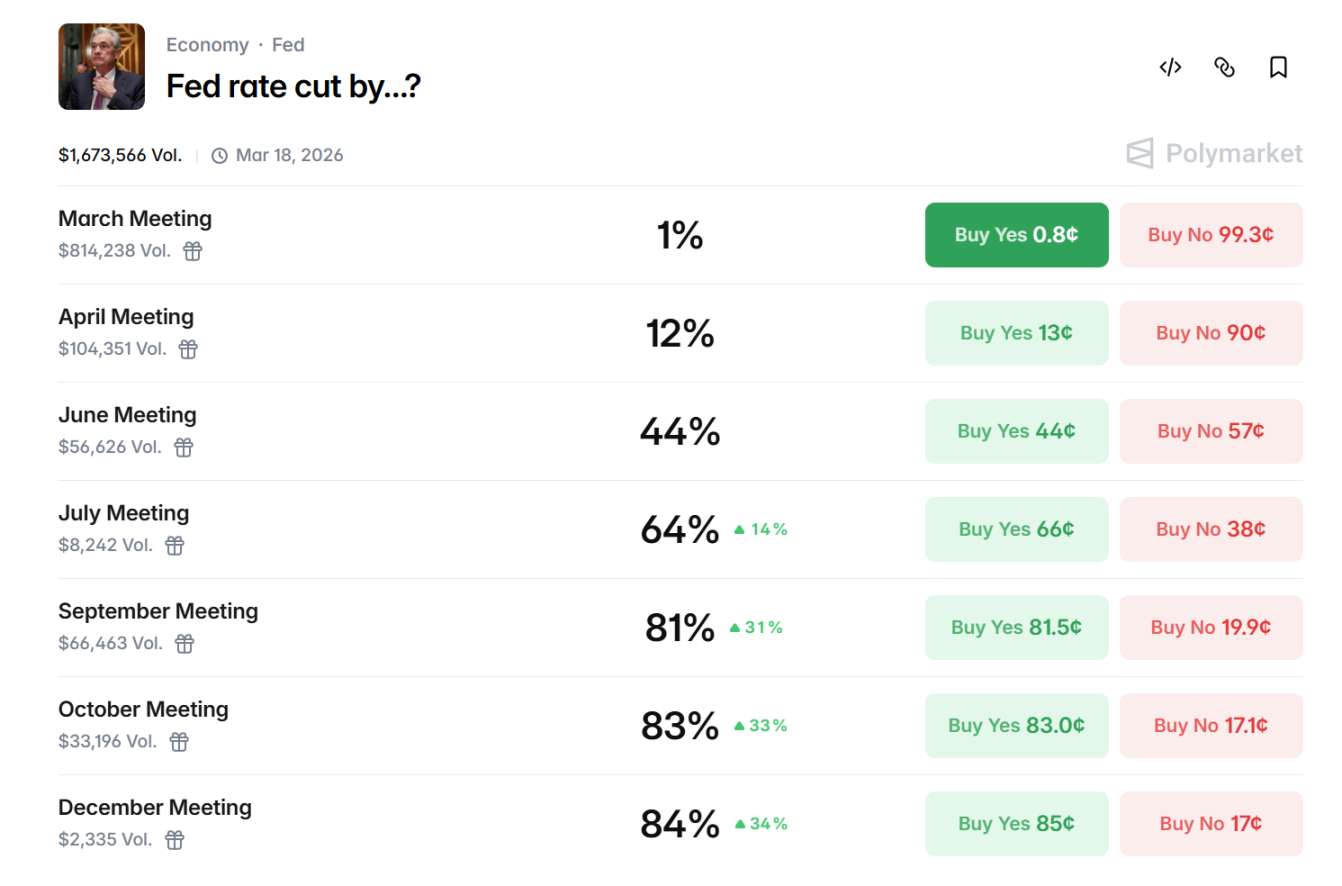
Data from Polymarket shows that the market is currently betting on an 81% probability of a rate cut in September, a 64% probability in June, and a 12% probability in April.
Looking ahead to the second half of the year, the path for Federal Reserve rate cuts still holds uncertainties. The evolution of the war, the trajectory of inflation, and employment data will become key variables. If energy prices continue to rise, the Federal Reserve may choose to extend the high-interest-rate cycle; conversely, easing geopolitical risks combined with a decline in core inflation could open up space for one or two rate cuts. For cryptocurrencies, maintaining high interest rates will continue to suppress risk appetite and valuations, but once clear signals of rate cuts emerge, market liquidity will recover, providing impetus for the price of Bitcoin to rise.
The Strait of Hormuz Becomes the Focus, Oil Crisis Imminent
The simultaneous outbreak of U.S.-Iran military conflicts further stirs the policy balance.
On February 28, the U.S. and Israel launched joint airstrikes against Iran, with the conflict lasting nearly two weeks, involving multiple rounds of strikes, risks to energy facilities, and regional chain reactions. Iran's potential control over the Strait of Hormuz raises global energy supply concerns, which is initially reflected in the rebound of the CPI energy component.
The Iranian Islamic Revolutionary Guard Corps (IRGC) has explicitly warned against allowing "a single drop of oil" to pass through the Strait of Hormuz and claimed that if the blockade continues, oil prices will soar to $200 per barrel. The strait, as a global energy chokepoint, is now effectively closed. Satellite data shows that most oil tankers are stalled on both sides of the strait or are rerouting; Iran broadcasts warnings that any ships attempting to pass will be attacked. Although the U.S. Navy provides escort, coverage is limited, resulting in a sharp reduction in actual traffic.

The Strait of Hormuz carries about 20 million barrels of crude oil and oil products daily, accounting for approximately 20% of global oil consumption, and one-fifth of the world's marine liquefied natural gas (LNG), mainly exported from Saudi Arabia, Iraq, the UAE, Kuwait, and Iran itself, with destinations mainly in Asia (China, India, Japan, South Korea, etc. dominate). Once this bottleneck is cut off, a structural gap in global supply will immediately appear.
From the perspective of macroeconomic transmission mechanisms, the U.S.-Iran conflict imposes systematic constraints on the path of Federal Reserve rate cuts through the core channel of oil prices. Firstly, the conflict directly impacts global oil supply security. The Strait of Hormuz accounts for about 21% of global oil maritime trade volume, and any risks of shipping interruption or military threat will immediately raise risk premiums, leading to significant upward pressure on international oil prices. Analysts warn that if the conflict persists, Iran will maintain the blockade, and short-term prices may test the range of $120-150 per barrel, or even higher; in the long run, if the strait is closed for more than a few weeks, a 1970s-style energy shock will reoccur, combined with cost-push inflation.
Historical cases clearly validate this logic: during the Gulf War in 1990, the sharp rise in oil prices led the Federal Reserve to pause its easing cycle; following the Middle East turmoil in 2011 and the 2022 Russia-Ukraine conflict, energy price shocks forced the Federal Reserve to prolong its tightening stance or delay easing moments. Although the current U.S.-Iran situation has not yet evolved into a full-blown energy crisis, its continued disturbance of oil prices is sufficient to make the FOMC more conservative when assessing financial conditions and inflation prospects, avoiding any potential easing signals that could amplify risks.
Market data shows that on March 12, Brent crude futures returned to above the $100 mark, rising nearly 9% on the day. WTI crude oil is currently reported at $93.52, with a daily increase of over 8%.
How Will BTC Perform Going Forward
Since October 2025, glassnode's on-chain data indicates that the 7-day index moving average for short-term holders has remained below 1, currently at 0.985, confirming that recent buyers are exiting at a loss—this is a characteristic of the bear market phase.
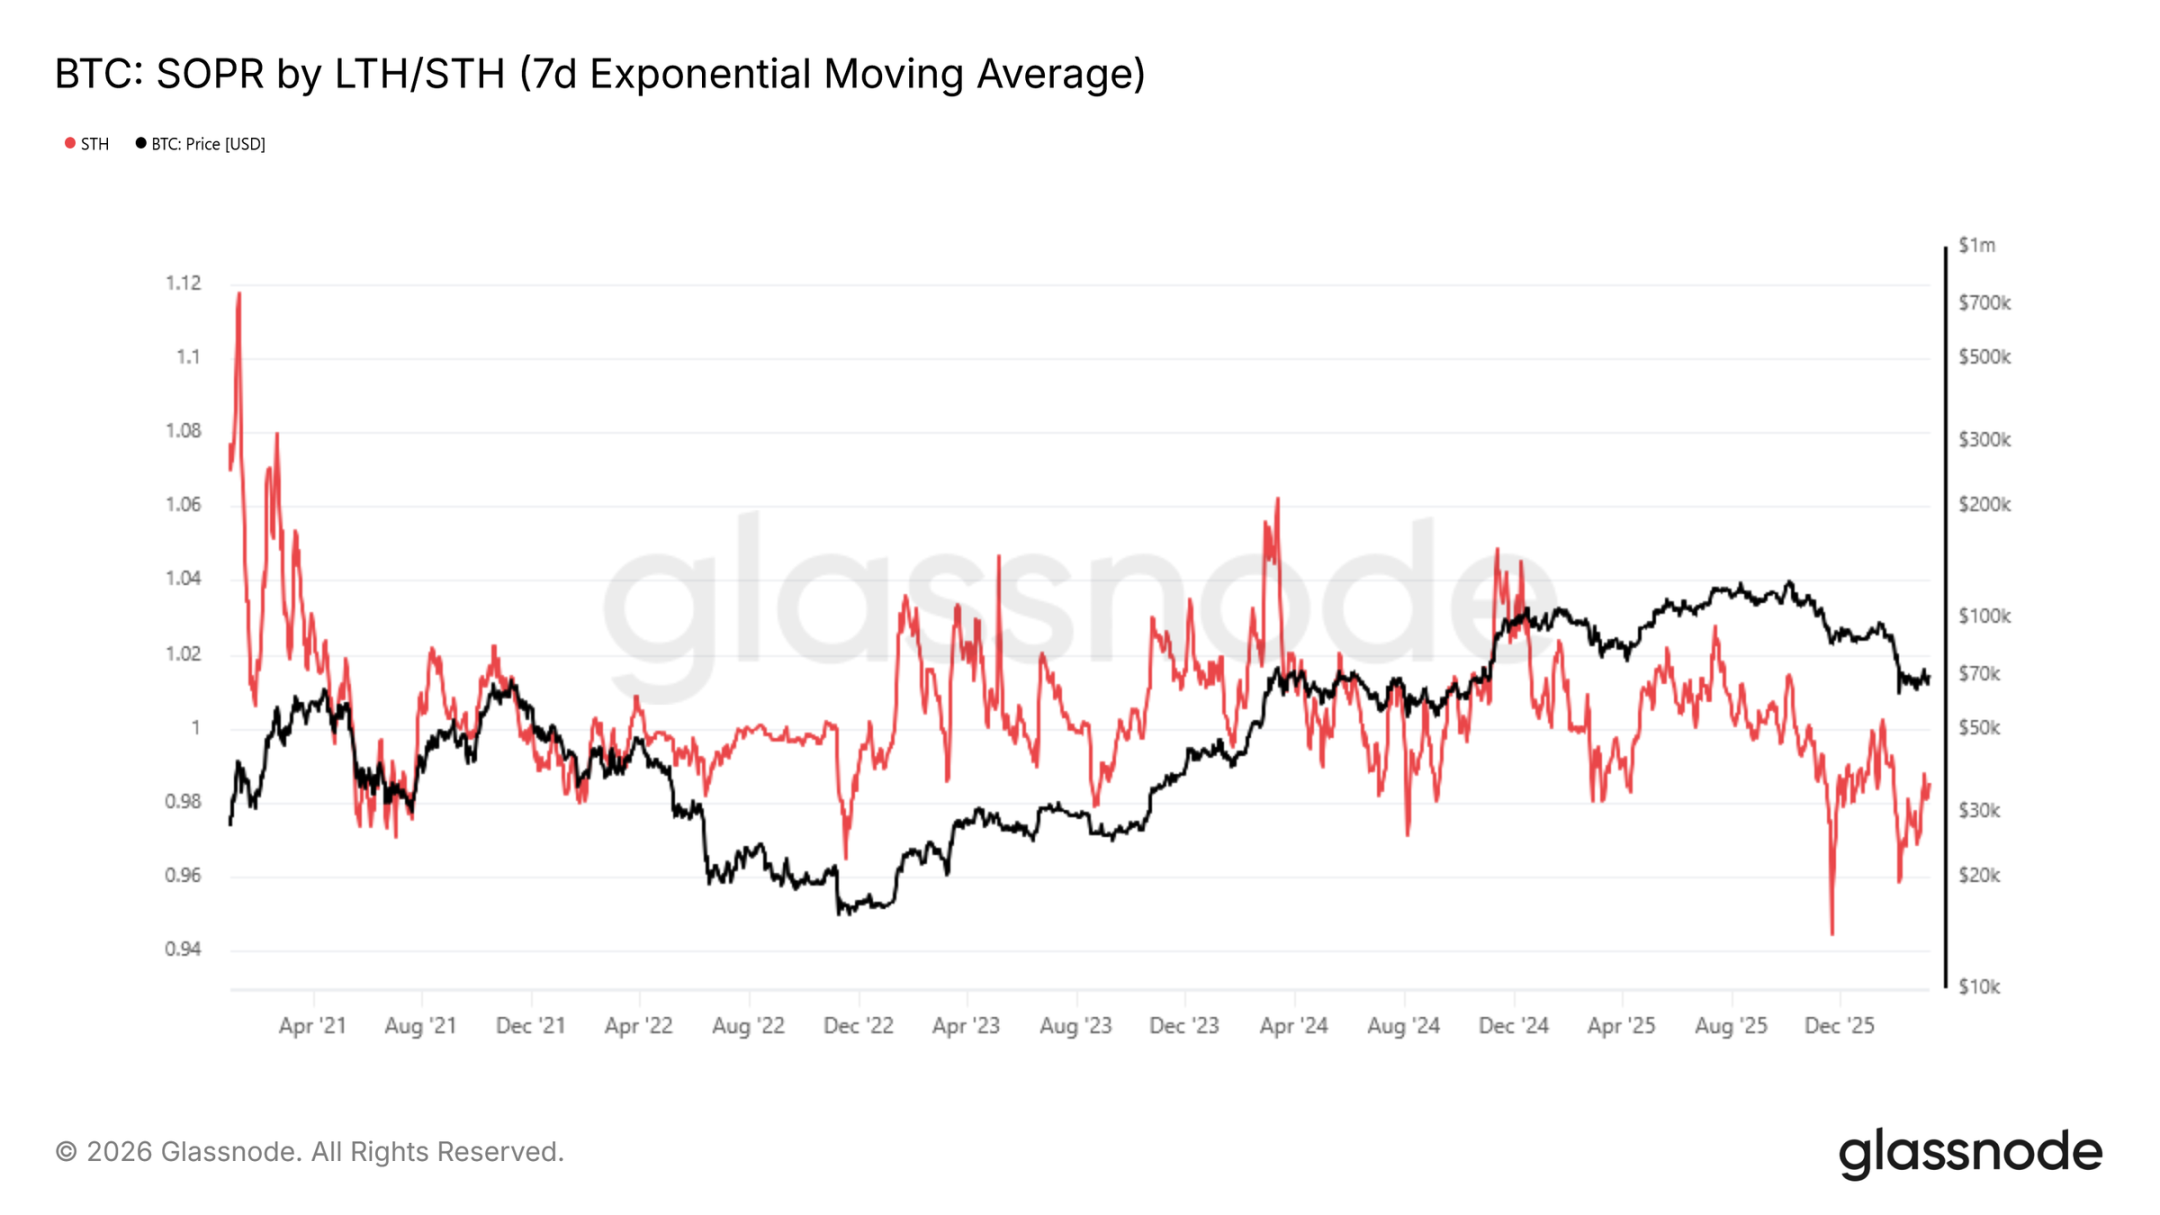
The price remains constrained between the realized price of $54,400 and the actual market average price of $78,400; it shows a clear negative skew in return rates until it decisively stabilizes above $70,000.
Wintermute stated that macro factors are currently dominating everything, but cryptocurrencies showed resilience last week while stocks, bonds, and even gold were declining. A high correlation between cryptocurrencies and stocks that has existed over the past few quarters is beginning to show fractures. The most likely explanation is that there are no more marginal sellers. The leverage in the cryptocurrency market is about $60 billion, roughly half of its peak level. In contrast, speculative positions in gold have significantly accumulated. When all assets are declining, the forced selling pressure that cryptocurrencies need to absorb is much smaller.
From a 12-18 month cycle perspective, the current price level is quite attractive, although the range in which BTC buyers are willing to enter extends from the current price all the way down to the $50,000 low. The market still has further room to dip, but most phases of deleveraging seem to be over. Currently, cryptocurrencies are holding their ground and narrowing the performance gap with other risk assets. Whether this trend can persist once trading volumes recover is yet to be seen. The upcoming FOMC meeting next week is a potential catalyst.
Regarding precious metals, according to Bitget's quotes, gold is currently fluctuating around $5,153, while silver hovers around $85. The U.S. Dollar Index (DXY) is currently fluctuating in the range of 99.35-99.48, and for U.S. Treasuries, the yield on 10-year government bonds is currently around 4.21%-4.25%, slightly rising on the day.
The S&P 500 index is still in a correction, currently reported at 6,775.8. The Nasdaq index is slightly up, currently reported at 22,716.
免责声明:本文章仅代表作者个人观点,不代表本平台的立场和观点。本文章仅供信息分享,不构成对任何人的任何投资建议。用户与作者之间的任何争议,与本平台无关。如网页中刊载的文章或图片涉及侵权,请提供相关的权利证明和身份证明发送邮件到support@aicoin.com,本平台相关工作人员将会进行核查。


