Bitcoin Chart Outlook
On the daily timeframe, bitcoin’s price structure reflects a market consolidating after a rebound from the $59,900 region. Bitcoin has largely oscillated between roughly $64,000 and $74,000, forming a sequence of gradually higher lows that suggests steady demand underneath the surface.
Current price action pressing toward the $70,000–$71,000 region places the asset near the upper portion of its recent range. The broader structure remains range-bound rather than trending decisively, which helps explain why momentum indicators are hesitant to pick a side.
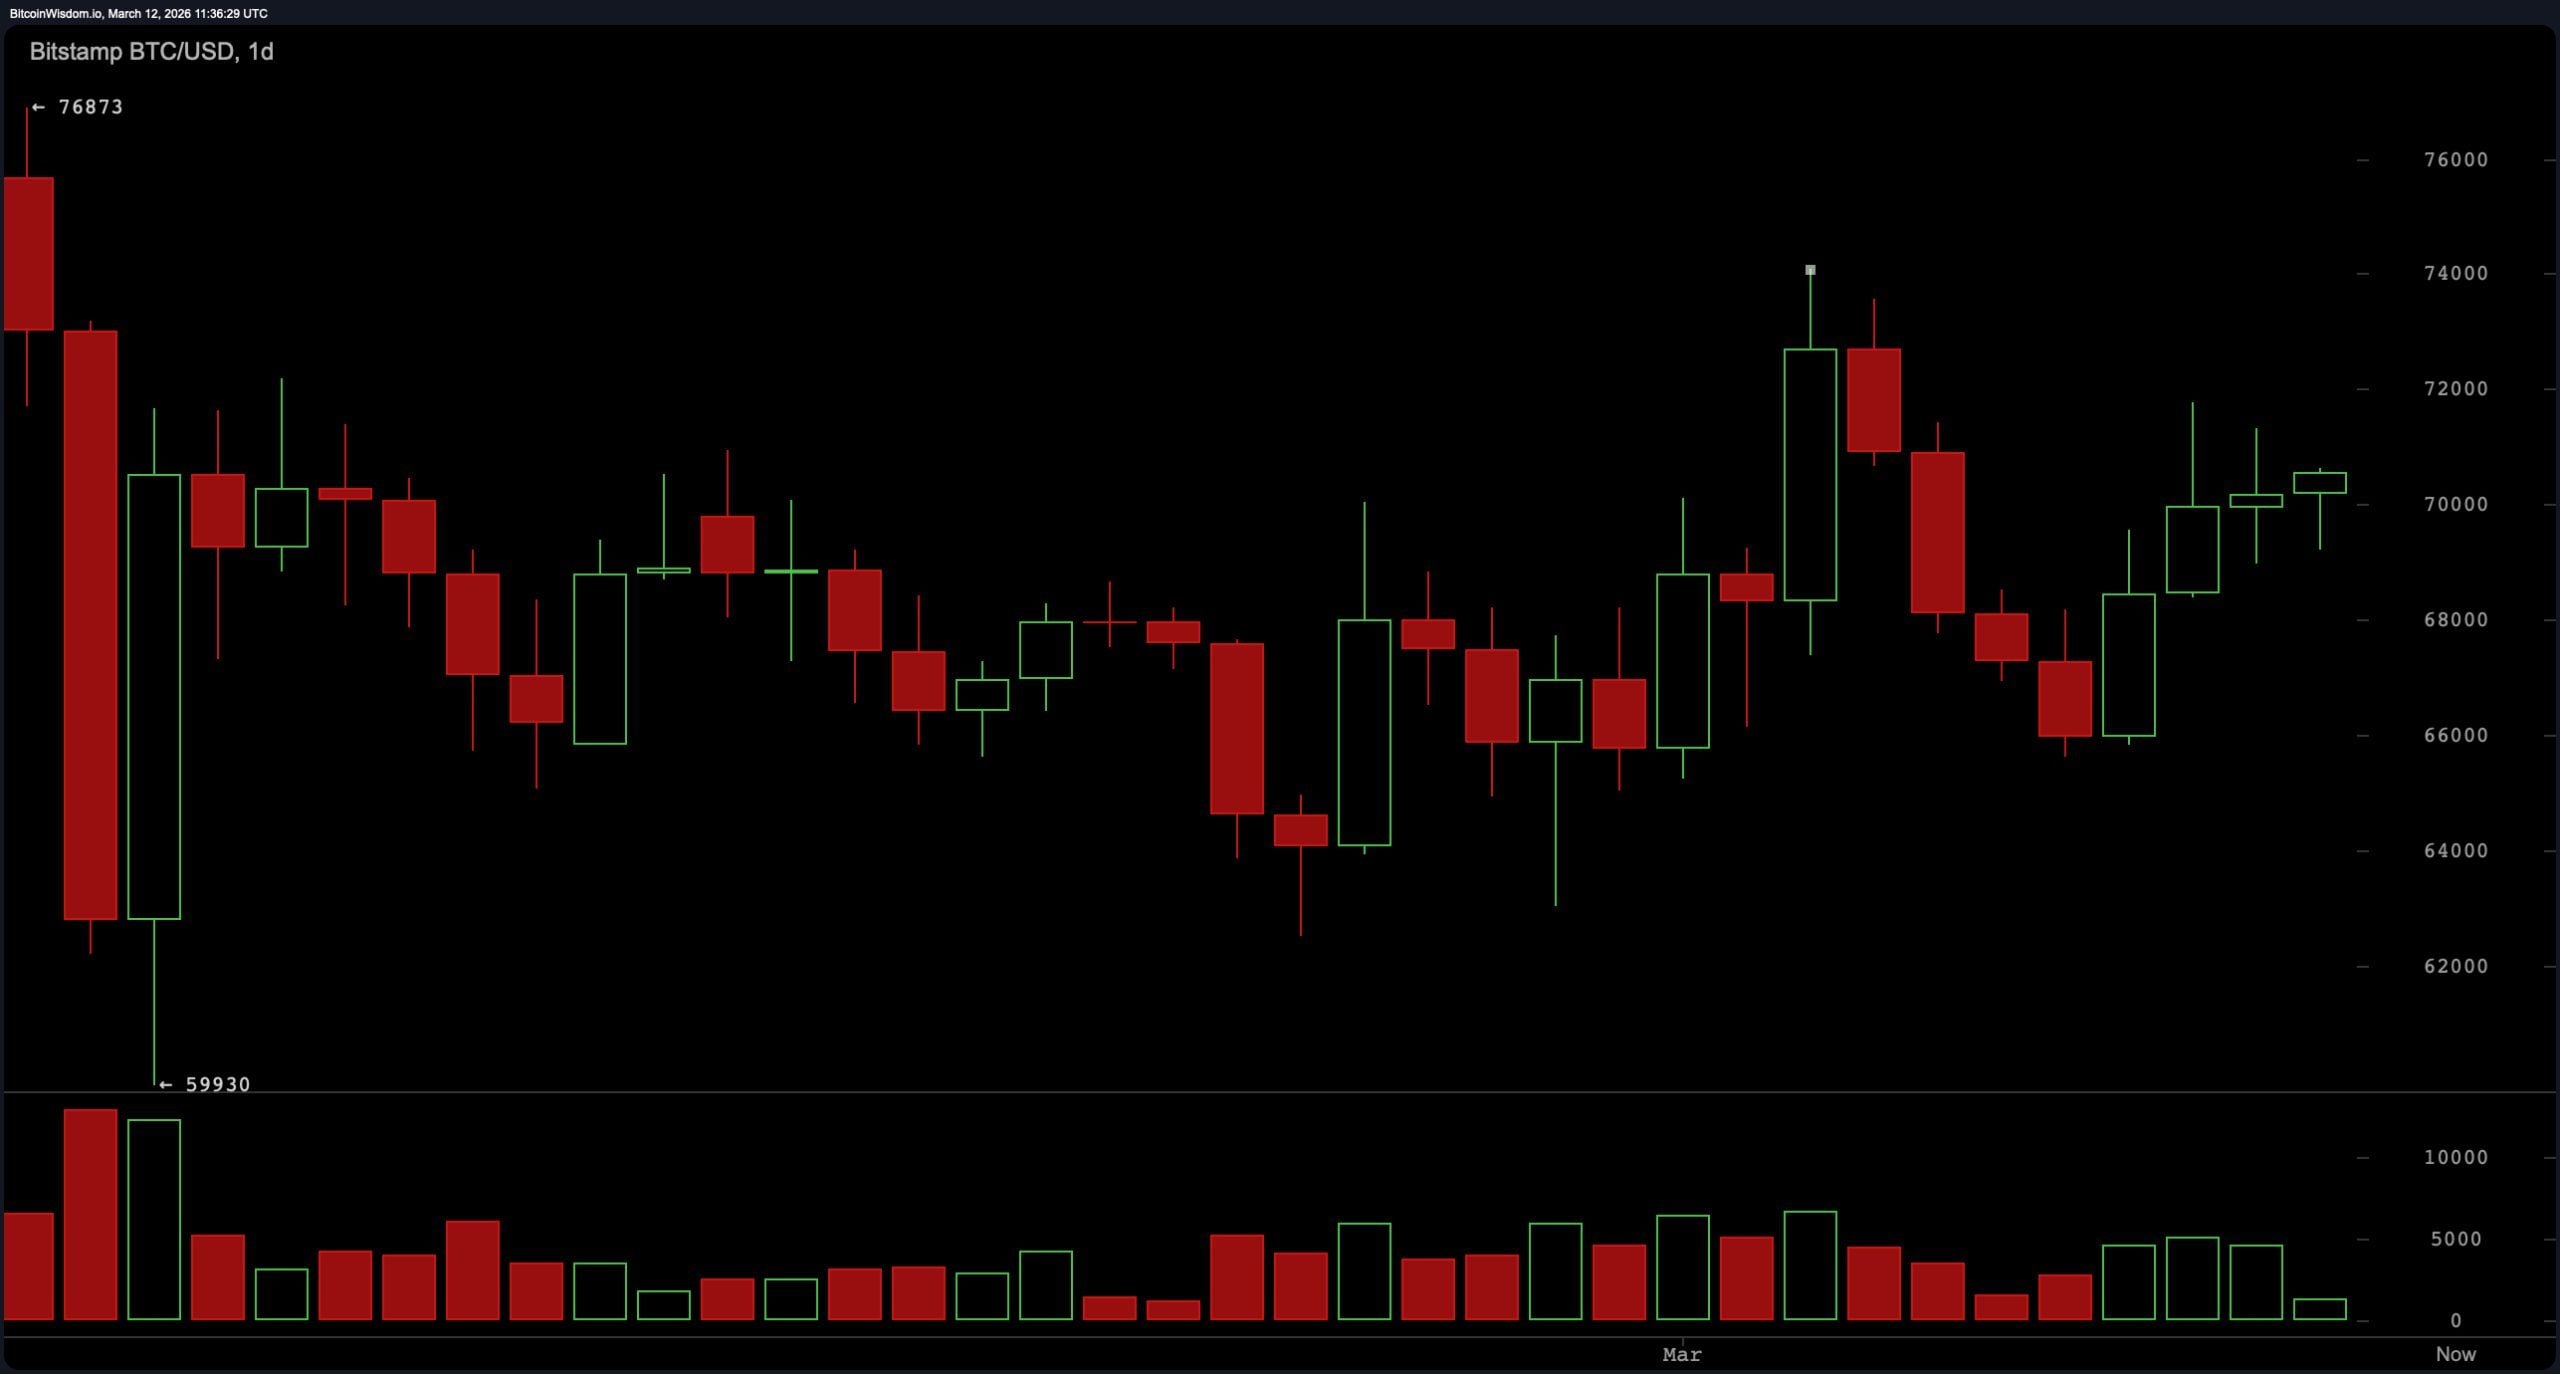
BTC/USD 1-day chart via Bitstamp on March 12, 2026.
The 4-hour chart presents a slightly more constructive picture. A clear upward move developed earlier in the week, with the price advancing from roughly $65,600 to around $71,175 before entering a controlled pullback phase. Rather than collapsing, the retracement stabilized near the $69,000 to $69,500 area and began printing higher lows. That pattern resembles a continuation structure, with price repeatedly finding footing around the $69,000 region. Resistance remains clustered between $71,100 and $72,000, a zone that has repeatedly slowed upward progress.
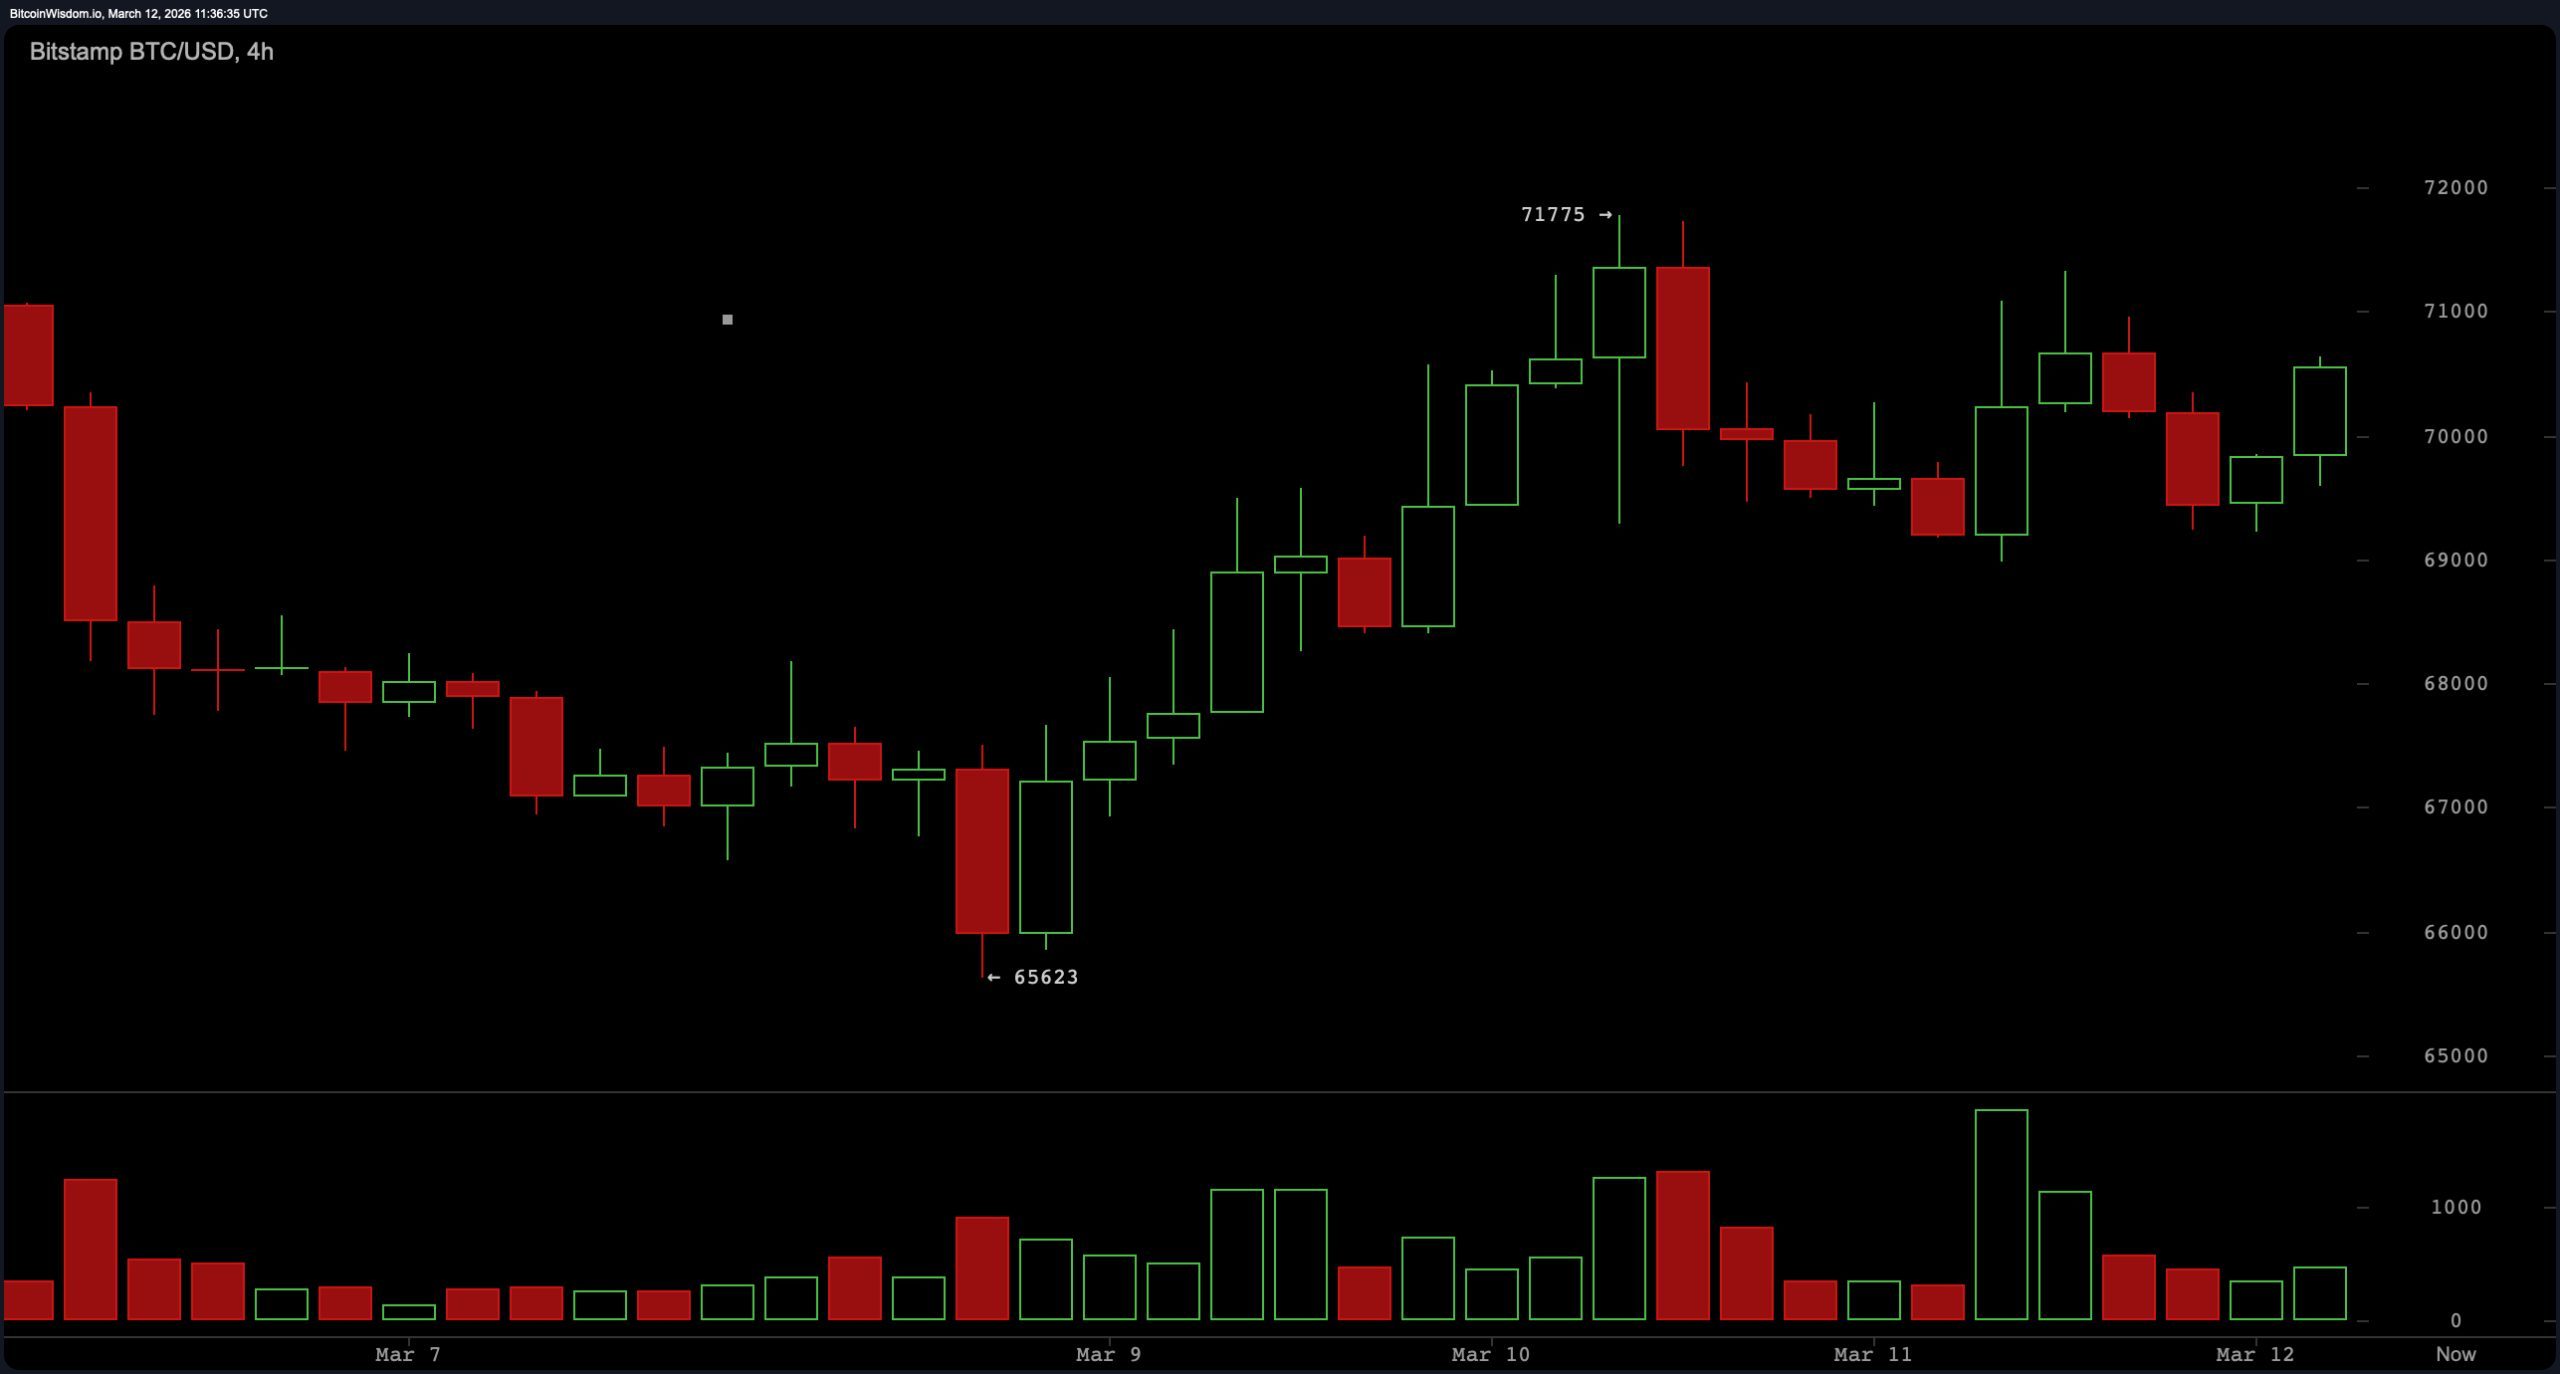
BTC/USD 4-hour chart via Bitstamp on March 12, 2026.
Short-term activity on the 1-hour chart shows the microstructure behind that stabilization. After establishing a local bottom at approximately $68,991, bitcoin moved upward through a staircase pattern of higher lows near $69,300, $69,800 and $70,200. The candles during this advance have generally been small and orderly rather than explosive, suggesting gradual accumulation rather than frantic momentum chasing. In other words, buyers appear willing to step in during dips, but they are not exactly kicking the door down either.
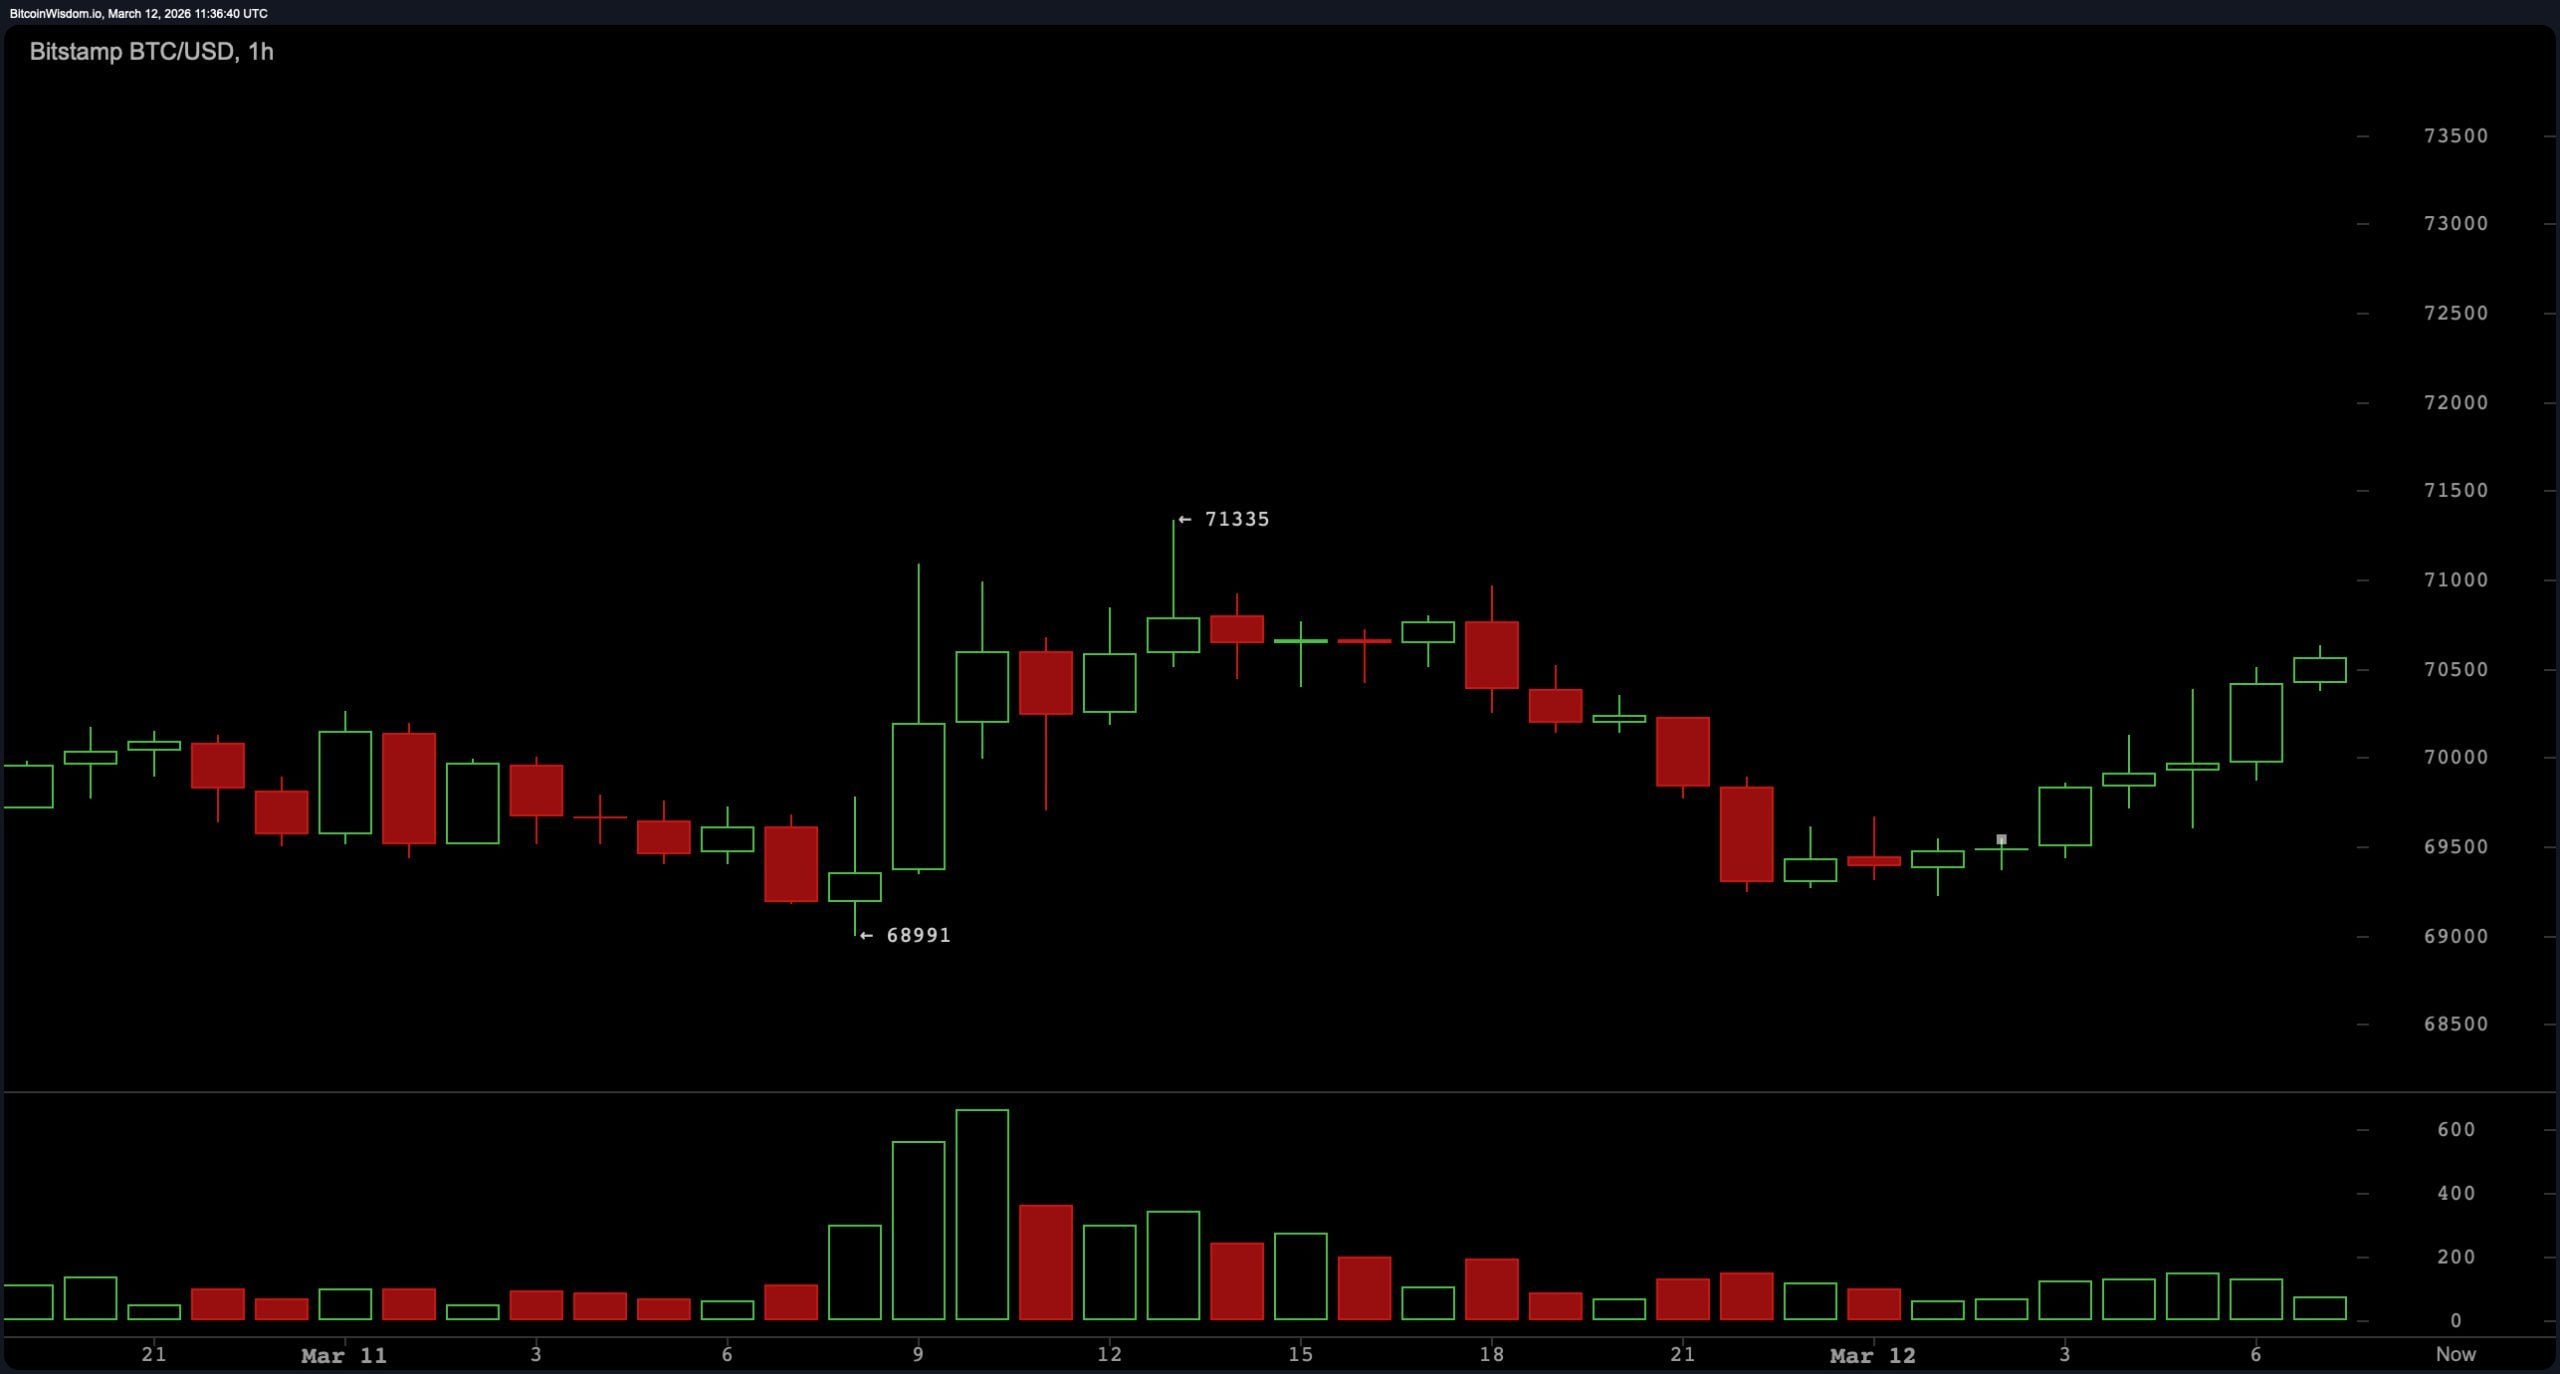
BTC/USD 1-hour chart via Bitstamp on March 12, 2026.
Oscillators paint a mostly neutral picture. The relative strength index ( RSI) reads 52.4, placing momentum almost perfectly in the middle of its range. The Stochastic percent stands at 65.2, while the commodity channel index (20) sits at 96.8 and the average directional index (14) prints 27.0, all signaling neutral conditions.
The Awesome oscillator registers 832.3, and the stochastic relative strength index fast comes in at 76.1, again neutral. Two indicators lean negative, with momentum (10) at 1,731.0 and bull bear power at 2,081.9, while the moving average convergence divergence ( MACD) level (12, 26) prints −533.0 with a positive signal reading. Overall oscillator totals show two negative signals, eight neutral readings, and one positive — the technical equivalent of a collective shrug.
Moving averages lean slightly more constructive in the shorter horizon. The exponential moving average (EMA) (10) sits at $69,056.0 and the simple moving average (SMA) (10) at $69,243.0, both below the current price. The EMA (20) at $68,962.7 and SMA (20) at $67,981.2 also remain beneath the market price, along with the EMA (30) at $69,939.2 and SMA (30) at $67,933.5.
However, longer-term measures still loom overhead: the EMA (50) at $72,924.0 and SMA (50) at $72,448.6, followed by the EMA (100) at $80,024.6 and SMA (100) at $81,373.5. Even higher, the EMA (200) sits at $88,323.9 and the SMA (200) at $94,526.1. Translation: short-term averages are supportive, while longer-term ones remain overhead like a skeptical chaperone.
Bull Verdict:
Bitcoin’s structure leans cautiously constructive as of March 12, 2026. Price is holding above several short-term moving averages, including the $69,056 exponential moving average (10), $69,243 simple moving average (10), and $68,962 exponential moving average (20), while the market continues printing higher lows across the 1-hour and 4-hour charts. Oscillators largely sit in neutral territory rather than overextended levels, which historically leaves room for directional expansion. If price maintains stability above the $69,000 support zone and presses through resistance between $71,100 and $72,000, the broader range ceiling near $74,000 becomes the next technical magnet.
Bear Verdict:
Despite short-term stabilization, the broader technical structure still faces significant overhead pressure. Bitcoin remains below multiple longer-term moving averages including the $72,924 exponential moving average (50), $72,448 simple moving average (50), $80,024 exponential moving average (100), and $88,323 exponential moving average (200). Oscillators also show limited conviction, with momentum (10) and bull bear power registering negative signals while most other indicators remain neutral. Should the repeatedly tested $69,000 support area fail, downside pressure could quickly expose lower technical levels around $67,800, $66,000, and potentially the broader range support near $64,000.
FAQ 🔎
- What is bitcoin’s price on March 12, 2026?
As of March 12, 2026, bitcoin is trading around $70,523 with a 24-hour range between $69,034 and $71,230. - What do bitcoin’s technical indicators show right now?
Most oscillators, including the relative strength index ( RSI), show neutral momentum while moving averages lean slightly positive in the short term. - What are the key support and resistance levels for bitcoin?
Technical charts show support near $69,000 and resistance between $71,100 and $72,000. - Is bitcoin trending up or down in the short term?
Bitcoin’s short-term structure shows higher lows on the 1-hour and 4-hour charts, suggesting modest upward momentum within a broader range.
免责声明:本文章仅代表作者个人观点,不代表本平台的立场和观点。本文章仅供信息分享,不构成对任何人的任何投资建议。用户与作者之间的任何争议,与本平台无关。如网页中刊载的文章或图片涉及侵权,请提供相关的权利证明和身份证明发送邮件到support@aicoin.com,本平台相关工作人员将会进行核查。


