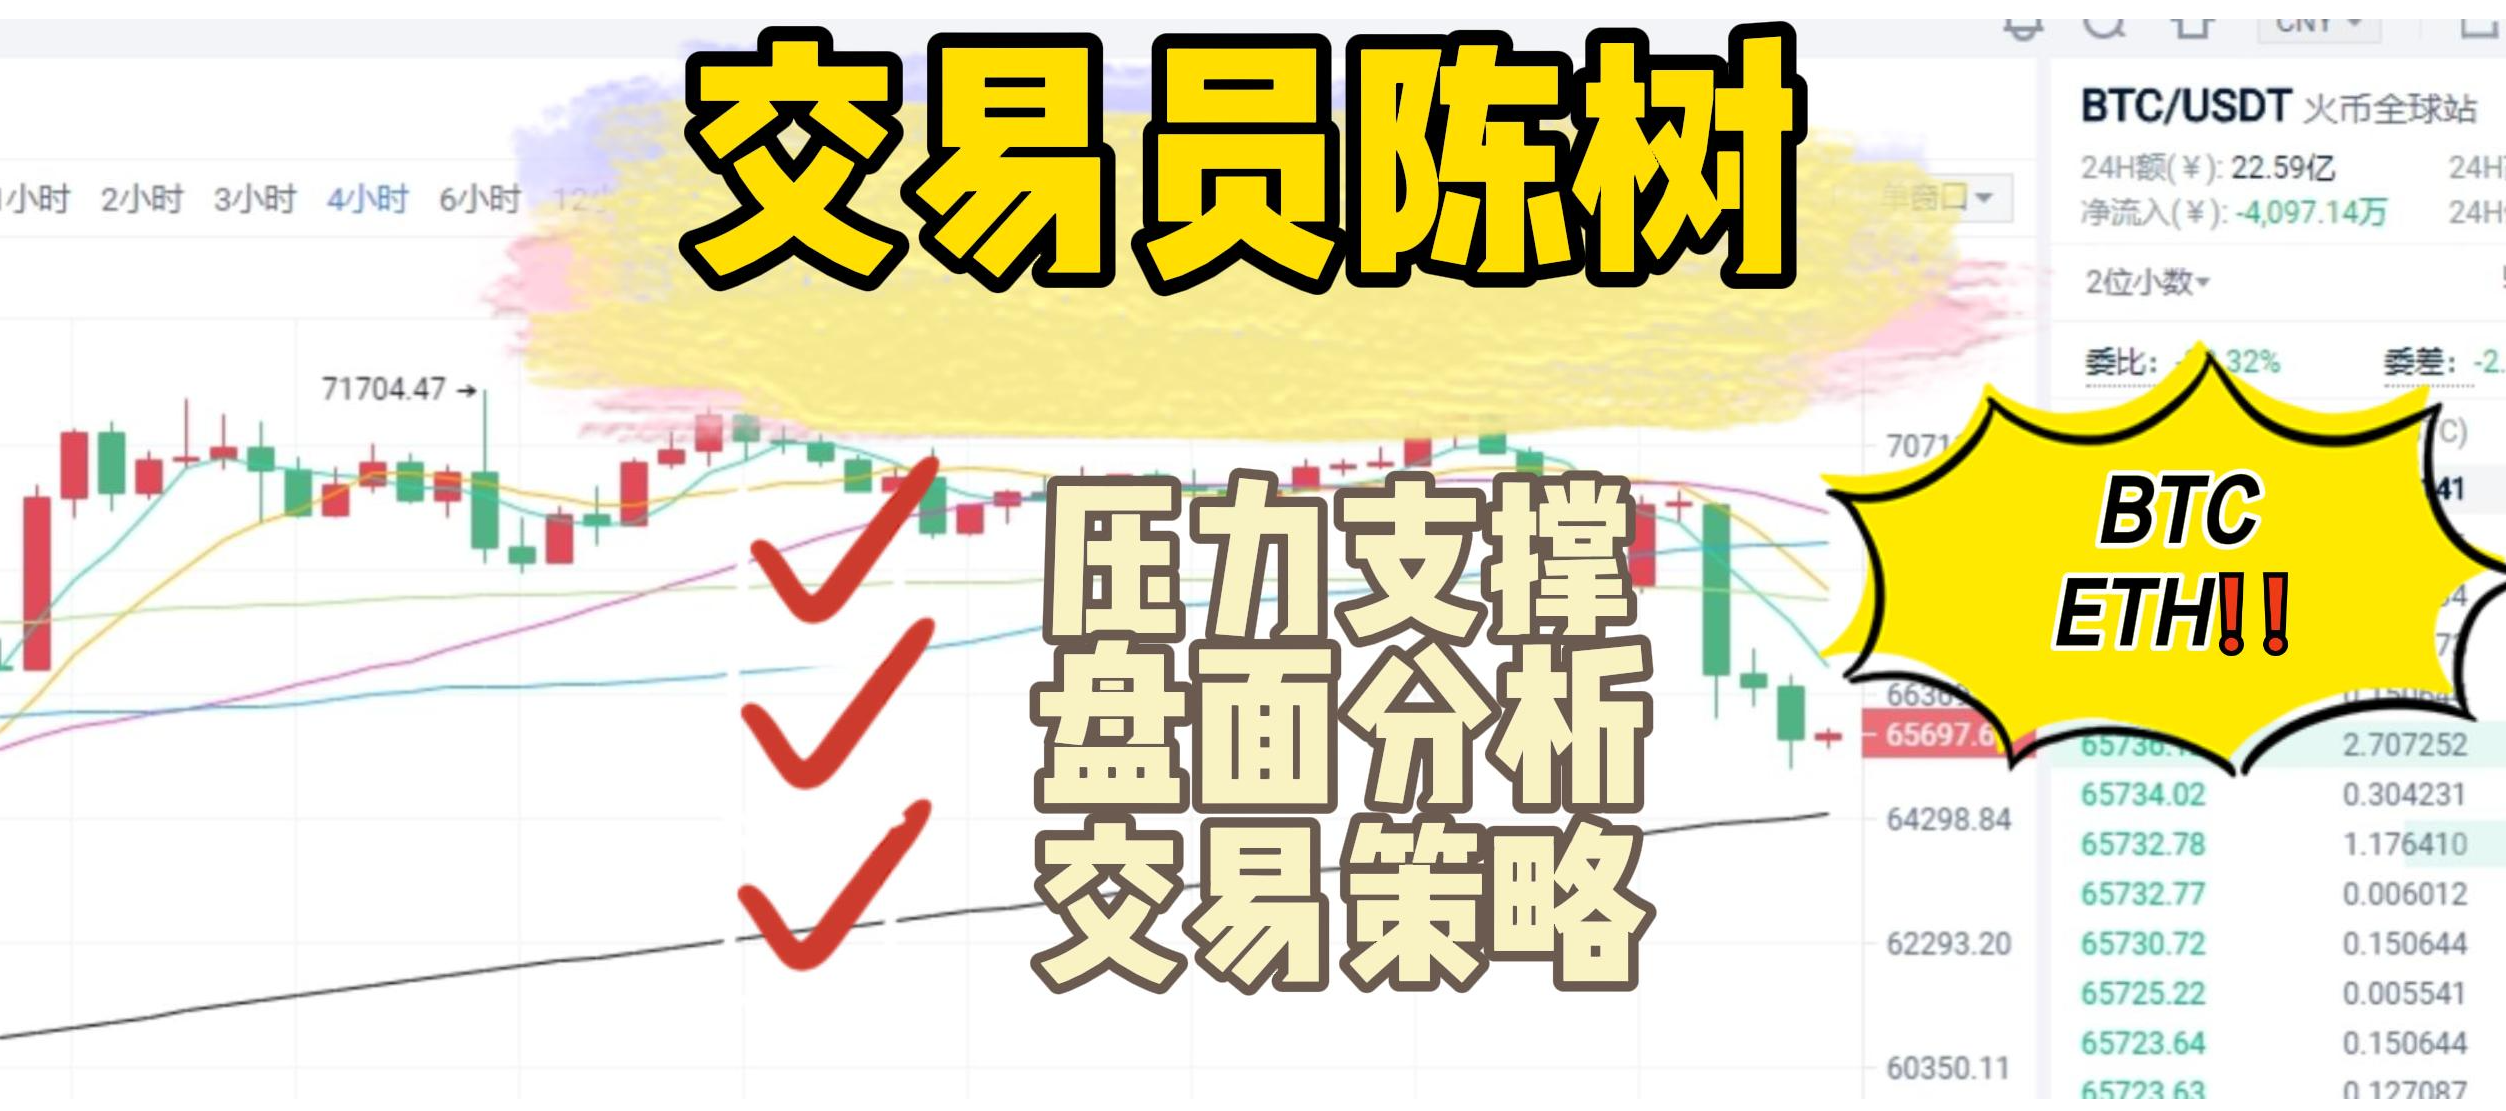
Trend Analysis
Candlestick Patterns:
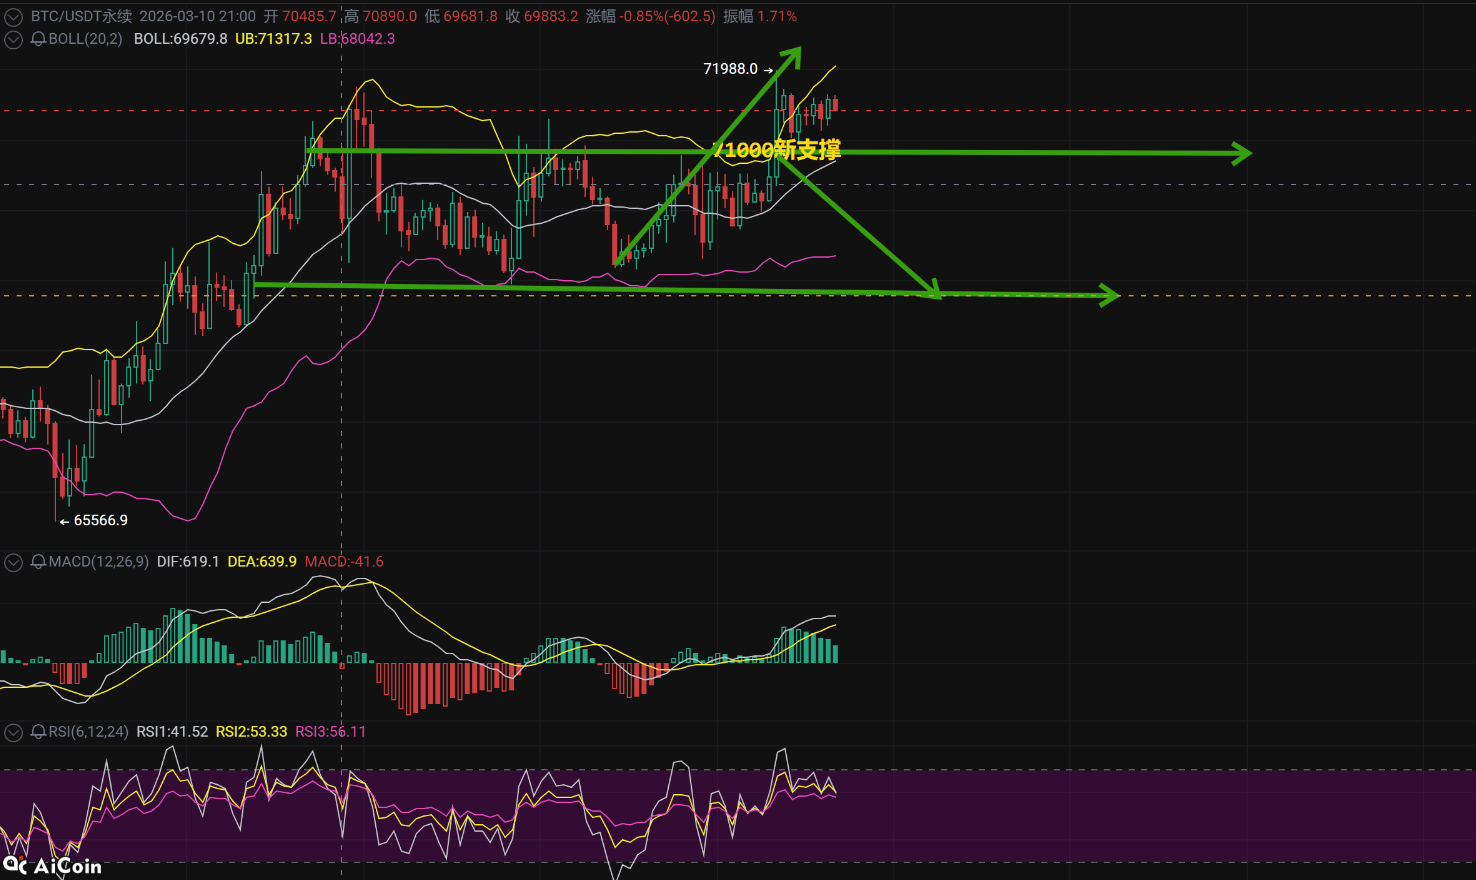
Today on the hourly chart, a long bullish candle breakout occurred at 8 AM, followed by high-level fluctuations, forming a range between 71631-71182. The daily chart has closed bullish for four consecutive days, with a single-day increase of 1526 points on March 10, displaying an accelerated upward trend. The key round number 71000 has been tested multiple times without breaking, while the 70000 level has formed strong support.
Technical Indicators:
MACD: On the hourly level, DIF 388 crosses above DEA 298, with the histogram continuously expanding; the daily MACD 1530 accelerates upward after a golden cross.
RSI: The hourly RSI at 61.5 retreats from overbought levels, while the daily RSI at 54.6 maintains a strong range.
EMA: The weekly, monthly, and quarterly EMAs are all in a bullish arrangement, with the current price (71524) stabilizing above all EMAs.
Trading Volume:
During the key breakout period (last night at 23:00), trading volume surged to 731. The trading volume in the most recent hour has exceeded the average of the strong two hours. Although the daily volume has declined, it remains above the 20-day average volume.
Strategy Suggestions:
Short Selling Suggestion: 72500-73000
Stop Loss Level: 73900-74100
Take Profit Level: 70500-70800
Long Buying Suggestion: 70500-70800
Stop Loss Level: 69100-69500
Take Profit Level: 73500-74000
(Investing in the cryptocurrency market requires caution. I sincerely wish every follower who pays attention to me achieves financial freedom soon. Communication, learning, cooperation, Earth Number: g18607105568)
免责声明:本文章仅代表作者个人观点,不代表本平台的立场和观点。本文章仅供信息分享,不构成对任何人的任何投资建议。用户与作者之间的任何争议,与本平台无关。如网页中刊载的文章或图片涉及侵权,请提供相关的权利证明和身份证明发送邮件到support@aicoin.com,本平台相关工作人员将会进行核查。