Coin Wave Riding: 3.13 Bitcoin (BTC) Market Analysis Reference:
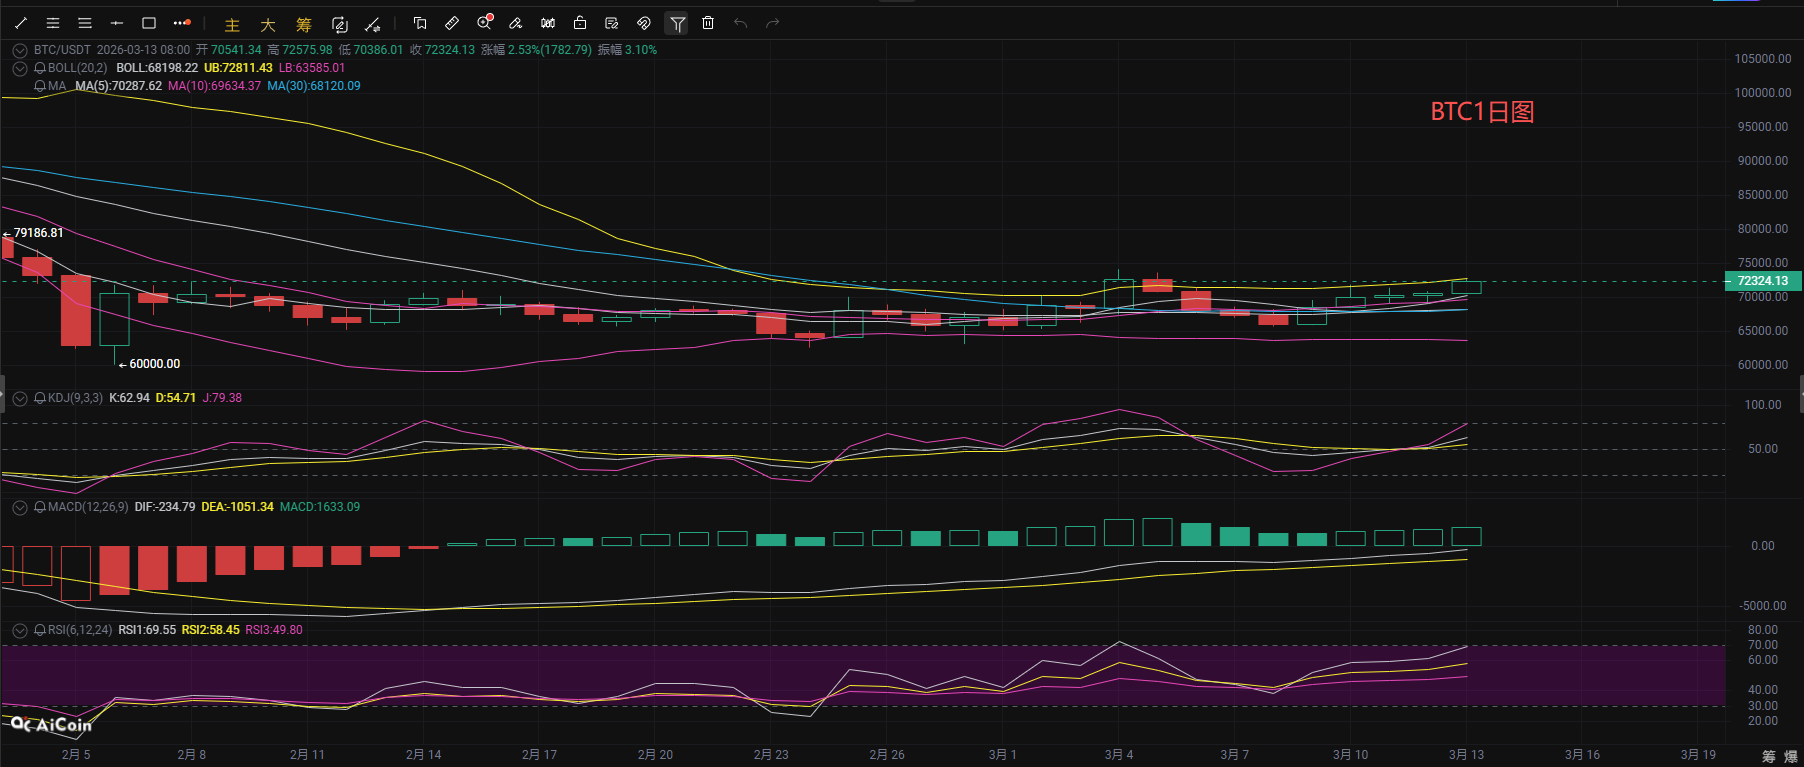
Bitcoin continues its rebound trend, with the day's overall market showing a fluctuating upward pattern. From the daily chart, Bitcoin has a continuous series of bullish candles. The daily MA5, MA10, and MA30 are in a bullish arrangement providing support. Currently, the coin price fluctuates around 72300, closely adhering to the upper Bollinger band with the middle band tilted upward, indicating a shift in medium-term trend from weak to strong; the KDJ three lines are diverging upward, and the MACD indicator's DIF and DEA are approaching the zero axis with the histogram gradually expanding, confirming a bullish signal at the daily level. However, the RSI is nearing the overbought threshold of 70, suggesting a slight pullback to build momentum is possible in the short term. The support level can be observed around the Bollinger middle band at 68200, and if it can break through the upper band at 72850, it is expected to open further upward space, maintaining an overall bullish trend.
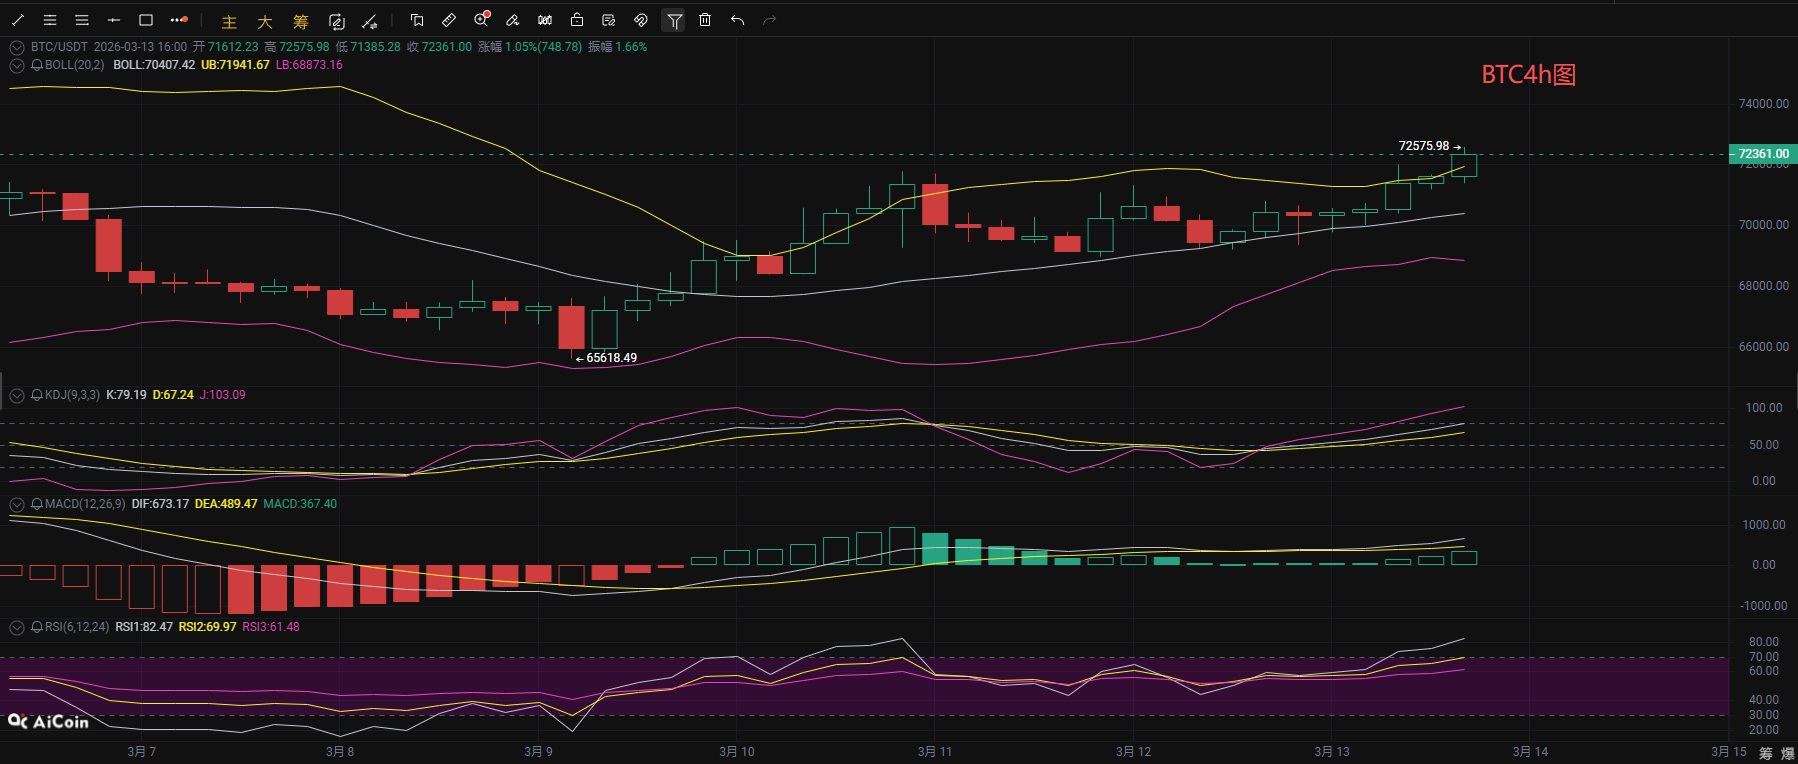
Observing from the short cycle hourly chart, in the 4-hour level, the price has continuously risen after stabilizing at a low, currently breaking through the upper Bollinger band, with the channel opening upwards, indicating a clear short-term bullish trend; the KDJ three lines are running at a high position with the J value reaching 107.79, in the overbought range. The MACD indicator's DIF has crossed above the DEA, and the histogram is positive, gradually releasing volume and confirming sufficient bullish momentum at the 4-hour level; however, the RSI has reached 81.72, entering a deep overbought area, suggesting a possibility of a short-term pullback and support confirmation. Support levels can be focused on the 4-hour Bollinger middle band at 70415 and the 1-hour middle band around 71000. If it can hold the support and digest the overbought pressure, there is still motivation to challenge new highs in the future. Overall, the short-term bias is bullish, but one must be cautious of the risk of a pullback.
Coin Wave Riding: 3.13 Bitcoin Short-term Reference:
Short Sell: Sell in the range of 73000-74000, stop loss 500 points, target at 72500-71500,
Long Buy: Buy in the range of 70500-71500, stop loss 500 points, target at 72000-73000,
Coin Wave Riding: 3.13 Ethereum Short-term Reference:
Short Sell: Sell in the range of 2150-2000, stop loss 30 points, target at 2100-2080,
Long Buy: Buy in the range of 2050-2080, stop loss 30 points, target at 2100-2150,
[The above analysis and strategies are for reference only. Please bear the risks yourself. The article review and publication may have delays, and the strategies may not be timely. Do not operate blindly.]

This article is originally shared by 【Coin Wave Riding】 and represents personal views only. The article has delay in sending and is for reference only; do not operate blindly! Want to get more daily real-time trades? Then follow my public account! Here, you can engage in online market technical learning and also understand the knowledge related to liquidation and exiting. I have years of research experience in the market, focusing on the major trends in the crypto space. Mainly responsible for analyzing and guiding investment operations for BTC, ETH, DOT, LTC, FIL, EOS, BCH, ETC, and other coins. Welcome to study and learn together.
免责声明:本文章仅代表作者个人观点,不代表本平台的立场和观点。本文章仅供信息分享,不构成对任何人的任何投资建议。用户与作者之间的任何争议,与本平台无关。如网页中刊载的文章或图片涉及侵权,请提供相关的权利证明和身份证明发送邮件到support@aicoin.com,本平台相关工作人员将会进行核查。