Welcome to Qinglan Crypto Class, I am Sister Qinglan. Let's get straight to the point:
Today we will continue to analyze from four cycles, all practical:
Step One: Trend Judgment
Let’s look from big to small!
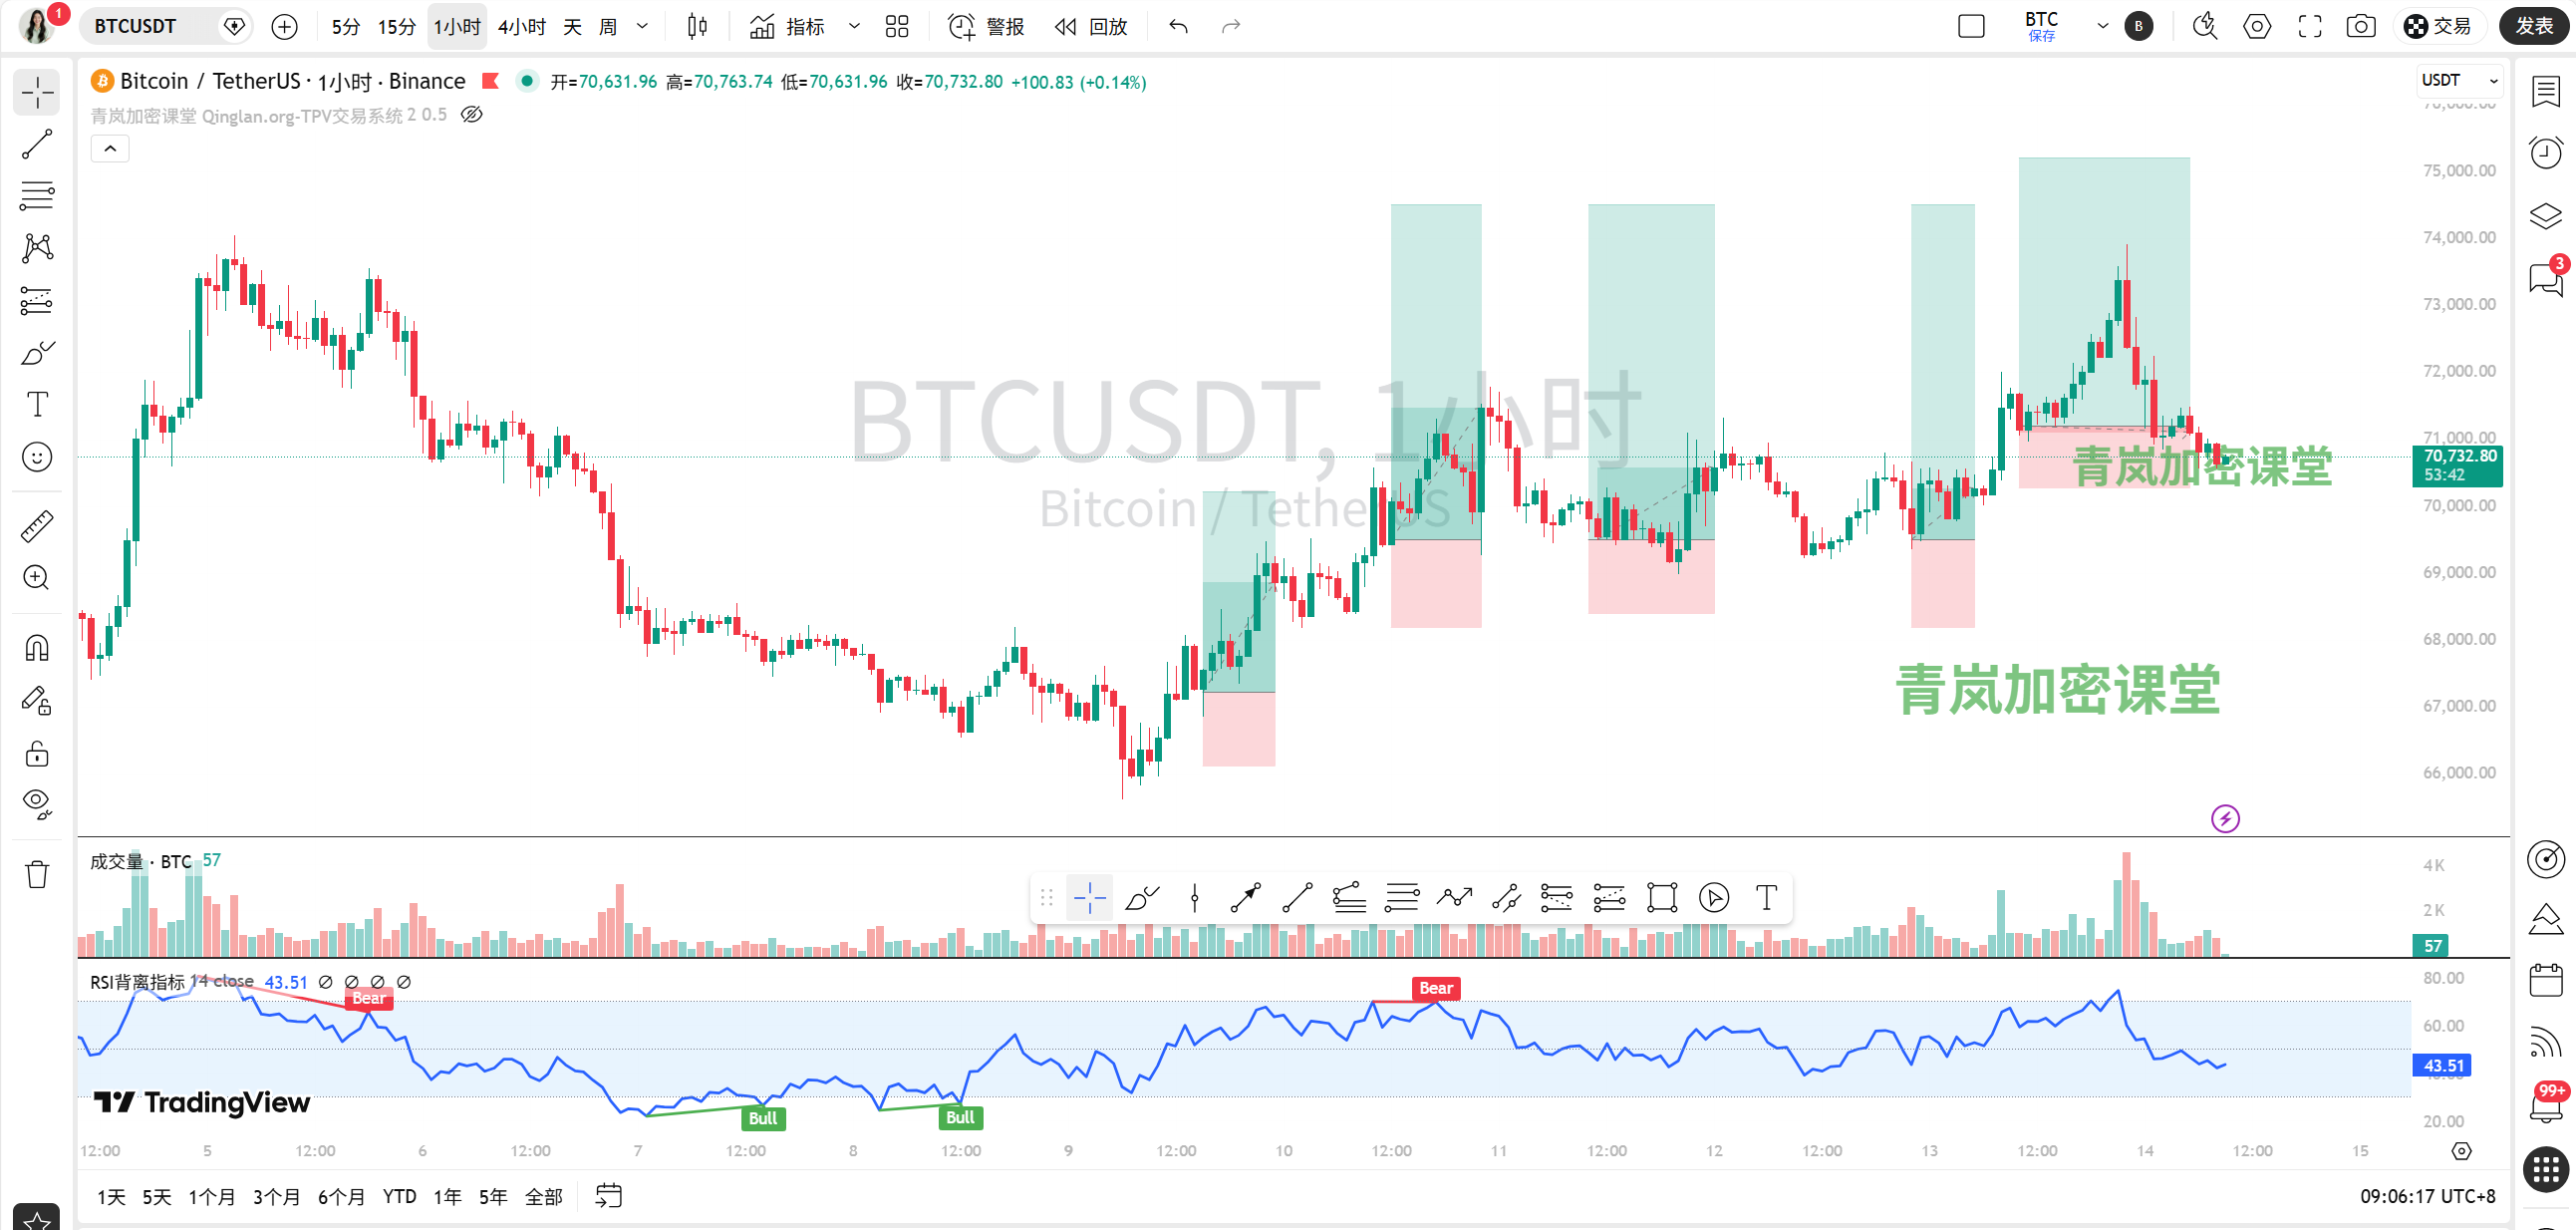
Daily Cycle: The trend is upward! You see MA5, MA10, MA30 are all in bullish alignment, the price is around 70616, still above the moving averages. The key resistance is around the previous high of 73913, with support at the integer level of 70000 and around 69205. However, on-chain data shows the fear and greed index is only 16, which is extremely fearful! This indicates that retail investors are frightened, deviating slightly from the rising price, possibly due to large holders supporting the price, but with such poor sentiment, be cautious of profit-taking causing selling pressure. News headlines also mention “BTC falls below 71000 USD”, indicating the market is sensitive.
4-Hour Cycle: The trend is also upward, but showing signs of fatigue! MA5, MA10, MA30 are also in bullish alignment, but the price is near 71359, close to MA5. Key resistance lies at 72228 and 73913, with support at 70555 and 70013. MACD has formed a death cross, which is an adjustment signal! Coupled with the news “Hormuz conflict escalates affecting the market”, geopolitical risks have made short-term funds hesitant, possibly intensifying the 4-hour level volatility.
1-Hour Cycle: The trend is downward! The moving averages are in bearish alignment, MA5 is at 70962, the price is at 70616, being pressed by the moving averages. Key resistance lies at 70930 and 71405, with support at 70334 and 69819. RSI is only 31.95, close to being oversold. The total market value has fallen by 0.64% over 24 hours, with funds flowing out, confirming the downward trend in the hourly chart, indicating short-term selling pressure indeed exists.
15-Minute Cycle: The trend is also downward! The moving averages are in bearish alignment, the price is at 70616, being suppressed by MA5 (70784). This is a very short-term downward trend. Resistance is at 70814, with support at 70300. The news “24-hour liquidation across the network amounts to 415 million USD, with short positions losing over 300 million” indicates that the leveraged market is experiencing fierce volatility, making it easy to be swept up and down in this short cycle during liquidation.
Step Two: Key Level Identification and Reversal Patterns
Daily: Currently no clear reversal patterns are seen, more like high-level fluctuations. We need to watch whether it can challenge 74000 again. If it falls below 70000, it may form a right shoulder for a double top, which poses higher risk.
4-Hour: We need to watch if it is constructing an “ascending wedge” or “flag consolidation”, as the high is at 72228 and the low at 70555, with the range converging. The news “BTC fluctuating at the upper range of 74000 USD” also refers to this range, and now the price is at the lower-middle of the range. If it breaks below 70555, it may test 70000 downwards.
1-Hour: It may be forming a “descending channel”, with the price constrained below 70930. If it breaks above 70930, this downward structure may be disrupted. The news “Bitcoin temporarily falls below 71000 USD” directly corresponds to this resistance area.
15-Minute: The pattern is too fragmented, but we can see a small-level “double bottom”, with low points around 70555 and 70616, and the neck line approximately at 70814. If it breaks above 70814, this short-term decline may ease. Analyzing the news "funding rate + technicals" often focuses on these small-level patterns.
Step Three: Technical Indicator Verification
Daily: The MACD histogram is positive at 719.97, but DIF and DEA are both far below the zero axis, indicating a rebound repair after a long-term bottom divergence. Momentum is still present. RSI is at 58.66, neutral but leaning towards strong, not overbought. The on-chain trading volume doesn't have specific numbers, but the total market cap has slightly declined, indicating that buying pressure at the daily level is temporarily resting.
4-Hour: MACD has crossed death! The histogram has turned negative, which is a clear signal of adjustment. RSI at 49.78, neutral, confirms the fluctuations. This death cross signal, together with the macro adverse news “oil price shocks may raise Fed's inflation forecast,” increases its credibility.
1-Hour: Both DIF and DEA of MACD are below the zero axis, the histogram negative values are expanding, indicating strong downward momentum. RSI at 31.95, close to the oversold zone, may suggest a technical rebound. However, on-chain sentiment is extremely fearful, limiting the rebound strength.
15-Minute: MACD is below the zero axis, but the histogram has turned positive (4.51), indicating a weak bottom divergence signal, suggesting that downward momentum is waning. RSI at 28.03, oversold! Therefore, a small rebound at any moment is not surprising, but we need to see if it can stand above the moving averages.
Step Four: On-Chain and News Comprehensive Analysis
News:
Negative: Geopolitical risks rising (Hormuz conflict), Fed's inflation concerns (high oil prices, PCE data), Marathon Digital selling BTC, Binance delisting contracts (affecting liquidity).
Positive: News of Bitcoin's strong rebound (indicating buying interest), whales accumulating ETH (which may drive market sentiment), retail purchasing volume plummeting (which may actually act as a contrarian indicator, reducing selling pressure).
Impact: Negative news has been more direct, causing prices to retreat from 74000 and test 71000. Positive news often describes events after the fact or as a localized phenomenon, failing to reverse the downward trend.On-Chain Data:
Sentiment: Fear and Greed Index at 16, extremely fearful! This is completely inconsistent with the price around 71000, a typical emotional divergence. Usually, this indicates a potential reversal signal, but needs price stabilization to confirm.
Capital: BTC's dominance is at 56.83%, still high, with funds still in Bitcoin. Total market cap slightly decreased by 0.64%, indicating no severe overall contraction.
Overall Assessment: The market is in a bizarre state of "high prices and low sentiment". This indicates that retail investors have been frightened off, but the coin price hasn't collapsed, possibly due to large holders or institutions supporting it. This divergence could either be a precursor to a significant drop or the end of a washout before a rise, which we need to observe closely!
Step Five: Market Prediction and Trading Thoughts
Current (within a few hours): There is a high probability of oscillating between 70500-71000. Because the 15-minute oversold condition has a need for a rebound, but the 1-hour trend is still under bearish pressure.
Key today and in the near term: The most important support today is 70555 (4 hours ago low and 15-minute double bottom); breaking below here may accelerate toward 70300 or even 70000. The most significant resistance is 70930-71000 (1-hour moving average and psychological level); breaking above this short term could shift momentum to strong.
Trading Strategy:
Trend-following opportunity (mainly bearish): If the price rebounds to the 70900-71000 area but fails to break above, with the 1-hour RSI not exceeding 50, a small short can be attempted, with a stop loss at 71200, targeting 70500.
Counter-trend opportunity (cautious long): If the price again tests around 70550 without breaking, and the 15-minute MACD forms a golden cross, a small long can be attempted for a rebound, with a stop loss at 70300, targeting 70900. This is going against the minor trend but following the major trend (daily upward), and should be quick in and out!
Watch and wait: If the price hovers near 70700 without significant movement, it's best to refrain from action and wait for the market to choose a direction. Particularly, we need to wait for tonight's US stock market opening to see the sentiment of risk assets.
Summary: The core contradiction in the current market is the significant divergence between “high prices” and “extremely fearful sentiment”, and the market is waiting for a catalyst to break this balance.
Trading Golden Phrase: When others are fearful, I am greedy, but don’t forget, first confirm whether others are genuinely fearful and not just fleeing.
Alright, that’s it for today’s analysis, let’s keep a close watch on the market and respond flexibly! Class dismissed!
More quantitative breakdowns on how real-time news affects market sentiment have been updated in my Qinglan Crypto Class: www.qinglan.org
免责声明:本文章仅代表作者个人观点,不代表本平台的立场和观点。本文章仅供信息分享,不构成对任何人的任何投资建议。用户与作者之间的任何争议,与本平台无关。如网页中刊载的文章或图片涉及侵权,请提供相关的权利证明和身份证明发送邮件到support@aicoin.com,本平台相关工作人员将会进行核查。