Wave Through the Currency Sea: 3.15 Cryptocurrency Market Analysis Reference for Bitcoin (BTC) and Ethereum (ETH) Tonight, News Interpretation
Wave Through the Currency Sea: 3.15 Bitcoin (BTC) Market Analysis Reference:
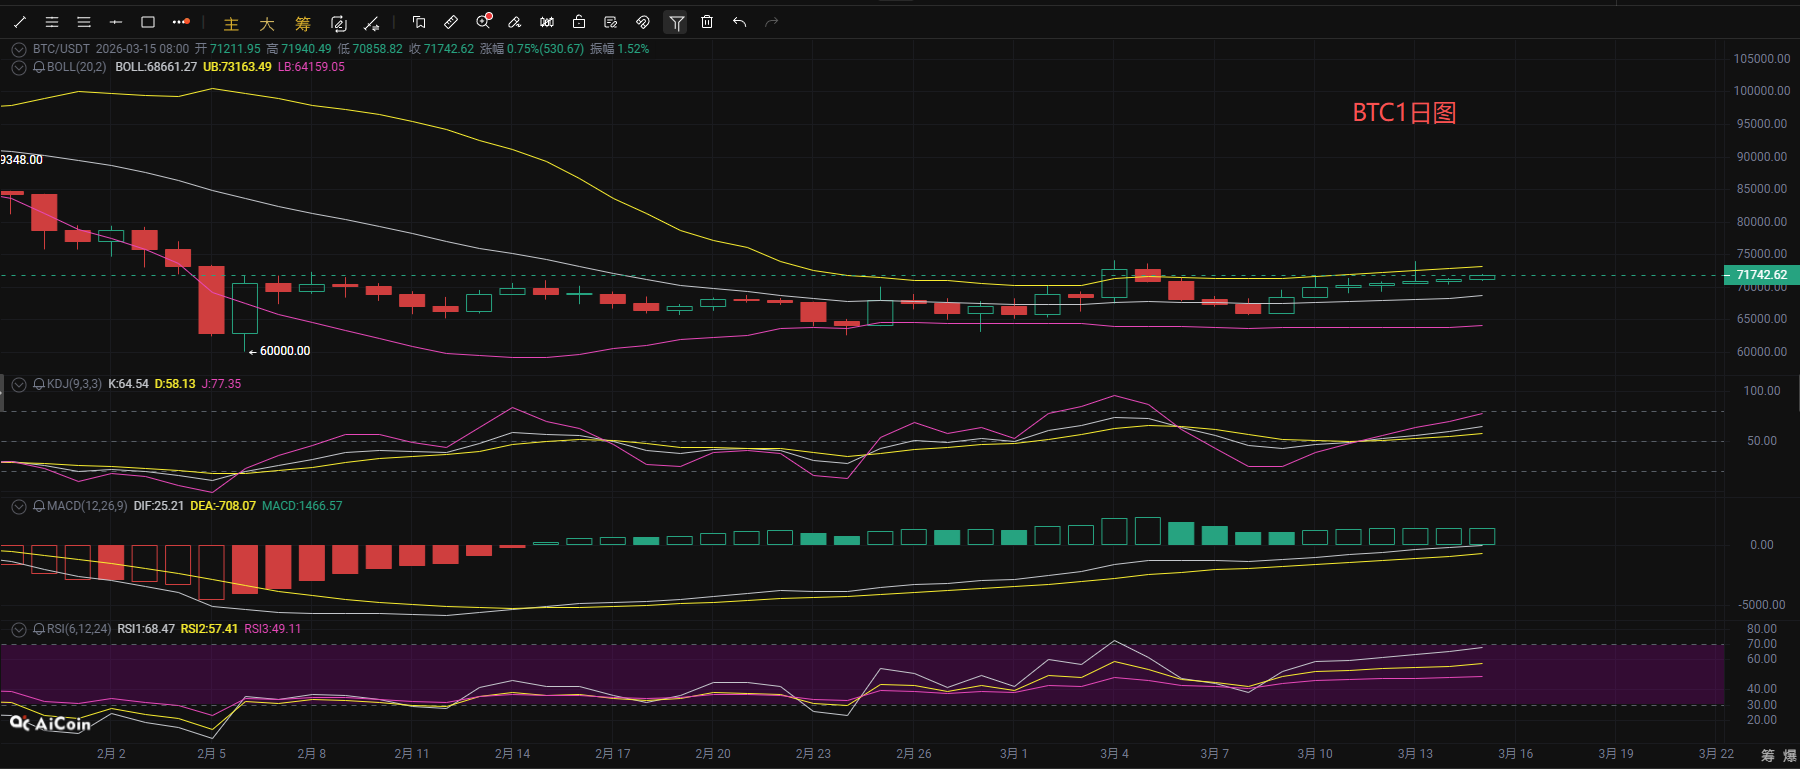
Bitcoin continued to consolidate in a weak pattern over the weekend, maintaining a narrow fluctuation trend. Compared to this morning, the price saw a slight recovery, and as of the time of writing, the price is operating around 71800. From the daily chart perspective, BTC's technical indicators show a balance between bulls and bears, but short-term bulls are slightly dominant. The BOLL indicator shows the price is running above the middle track with a slightly opening upper track, indicating a moderate expansion trend, suggesting short-term fluctuation space has opened up, with bulls temporarily occupying an active position within the channel; the MACD indicator's fast and slow lines are diverging upwards, with red bars continuously increasing, reflecting that bullish momentum has not weakened, but one must be vigilant about the risk of high-level momentum gradually exhausting; the KDJ indicator is in the neutral to strong range of 50-80, with no obvious signs of overbought stagnation, and short-term trends may continue; the RSI indicator is close to 70, though it has not entered the overbought area, it is nearing the threshold, suggesting that upward chasing momentum is beginning to be limited. The mid-term trend remains dominated by upward fluctuations, with core support at the integer level of 70000 and around the middle track of the Bollinger Band at 68600, while the upward pressure looks towards the previous high of the 74050 range.
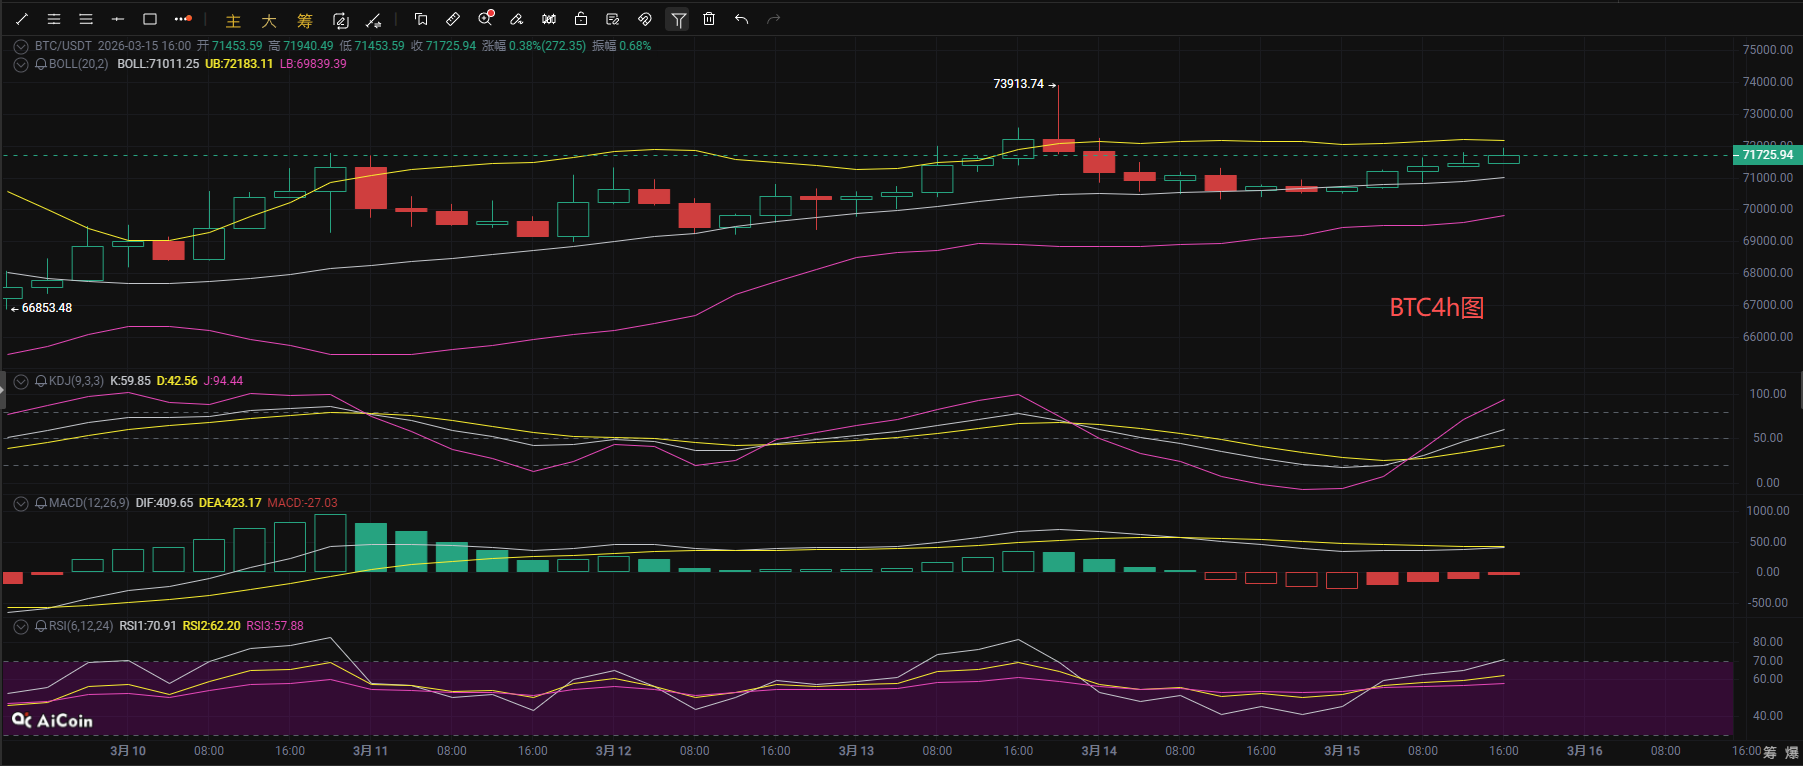
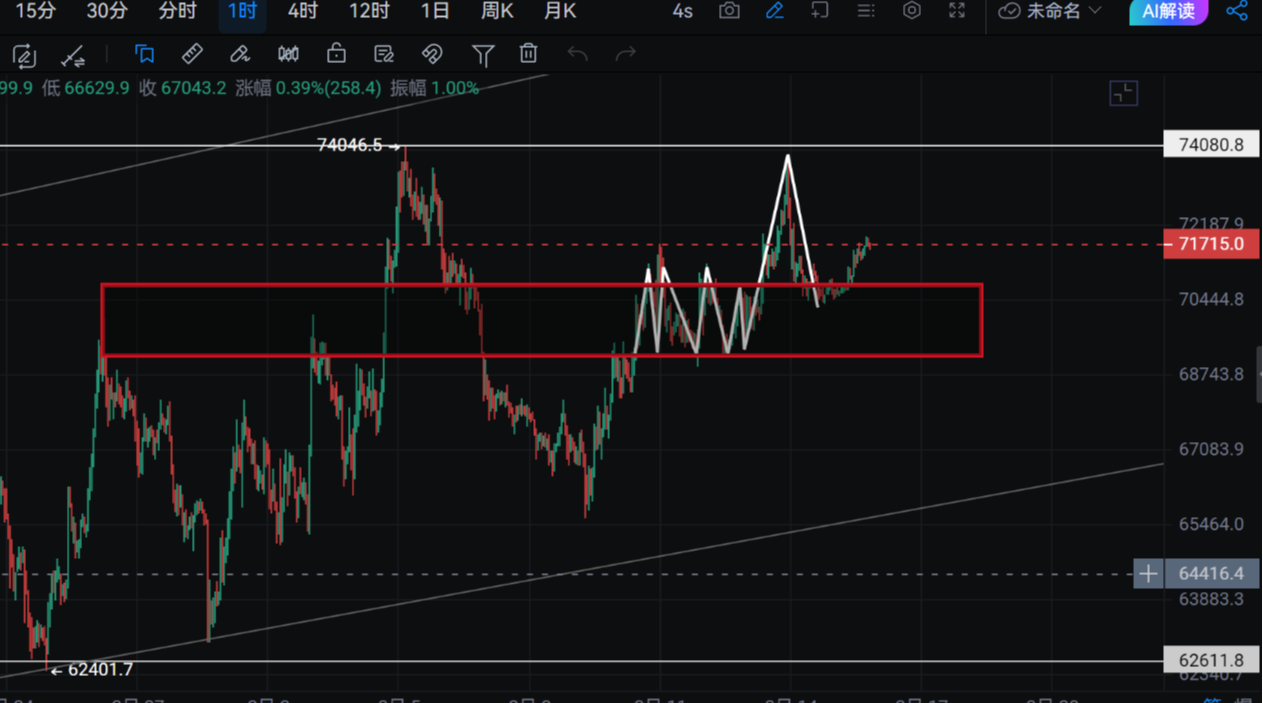
From the short-term hourly chart observation, on the 4-hour chart, the price is between the middle and upper tracks of the Bollinger Band, with the Bollinger Band consolidating. The MACD fast and slow lines are closely aligned and show signs of forming a golden cross, with volume gradually converging on the negative side, indicating that bearish strength at the 4-hour level is depleting, and there are signs of bullish momentum rebounding; the KDJ indicator's J value is in the overbought range but has not yet turned downward, indicating a short-term inertia for further upward movement; the RSI indicator RSI1 is at 72, in the overbought area, suggesting there is certain selling pressure above, but it has not triggered a clear retracement signal. It is expected that the BTC on the 4-hour level will likely maintain a strong fluctuation trend, with the first resistance level looking towards the upper track of the Bollinger Band and the previous high of 73913. On the 1-hour chart, the current price has touched the upper track of the Bollinger Band and has retraced slightly, with the Bollinger Band opening upward but the upward slope has slowed. The MACD indicator's fast and slow lines still maintain a golden cross, with slight volume increase; the KDJ indicator's J line is turning downward, with signals of a dead cross gradually appearing. The RSI indicator RSI1 is at 66.33, having turned downward from the previous high, detaching from the edge of overbought. This further confirms that the selling pressure above is being released, increasing short-term retracement pressure and visibly weakening the upward momentum. It is expected that there may be a short-term pullback to the support around the middle track of the 1-hour/4-hour Bollinger Band near 71100. If it does not break, there is a high probability of continuing to test resistance levels upward. In terms of operation, it is recommended to primarily focus on setting long positions during short-term dips.
Wave Through the Currency Sea: 3.15 Bitcoin Short-term Reference:
Short Position: Sell in the range of 72200-73200, defend at 74200, target for 72000-71000.
Long Position: Buy in the range of 69500-70500, stop loss at 500 points, target for 71500-72500.
Wave Through the Currency Sea: 3.15 Ethereum Short-term Reference:
Short Position: Sell in the range of 2150-2180, stop loss at 30 points, target for 2080-2030.
Long Position: Buy in the range of 2045-2085, stop loss at 30 points, target for 2100-2180.
[The above analysis and strategies are for reference only; risks are to be borne by yourself. The article may have delays in review and publication, and strategies may not be timely. Please do not operate blindly.]

The content of this article is an original share from [Wave Through the Currency Sea], representing only personal opinions. There may be delays in article dissemination, and it is for reference only. Please do not operate blindly! Want to receive more real-time updates daily? Then follow my public account! Here, you can engage in online technical learning about the market and learn about liquidation and exit strategies. I have years of research experience in the market, focusing on the major trends in the cryptocurrency space. I mainly analyze and guide investment operations for BTC, ETH, DOT, LTC, FIL, EOS, BCH, ETC, and other currencies. Welcome to study and research together.
免责声明:本文章仅代表作者个人观点,不代表本平台的立场和观点。本文章仅供信息分享,不构成对任何人的任何投资建议。用户与作者之间的任何争议,与本平台无关。如网页中刊载的文章或图片涉及侵权,请提供相关的权利证明和身份证明发送邮件到support@aicoin.com,本平台相关工作人员将会进行核查。