Author: Michel Athayde, Bitget Wallet BD Ambassador
Abstract
In traditional financial markets, buying deep out-of-the-money puts for the long term is often seen as a typical “black swan insurance” strategy: consistently losing premiums until an extreme risk occurs, at which point recovering losses or even gaining significantly. The question is, does this logic hold in the more volatile and frequently crashing cryptocurrency market?
The answer provided by this backtest is not straightforward. Based on historical data from January 1, 2018, to March 14, 2026, we conducted systematic testing on BTC and ETH: purchasing one deep OTM put each month, holding it until expiration, without timing the market. The results show that this is not a “stable earning” strategy but rather a tail insurance tool with extreme right skew, very low win rates, and strong path dependence. Under the benchmark portfolio, BTC's final total return was 97.62%, while ETH was -73.07%; in other words, applying the same logic across different assets could yield completely opposite long-term results.
Research Background
“Long-term insurance buying” has always been one of the most contentious strategies. Proponents argue that the long-term fate of capital is not determined by daily fluctuations but by a few systemic crashes; opponents believe that paying premiums year after year essentially uses certain losses to gamble on uncertain disasters.
The cryptocurrency market makes this debate even more interesting. On one hand, the volatility of BTC and ETH is significantly higher than that of traditional assets, with crashes being common; on the other hand, extreme market conditions occur more frequently, theoretically making them more suitable for tail hedging survival. Thus, a key question arises: if we mechanically buy one deep OTM put every month since 2018, without timing the market or judging cycles, can this “dumbest” form of tail insurance make money in the long run?
Strategy Design
The rules of this test are very simple and very strict. On the first natural day of each month, open a position. If there are no original observation data on that day, delay to the next trading day; buy 1 European put, hold until expiration, without early profit taking or loss cutting. The target Delta for the benchmark portfolio is 0.01, with an expiration date 30 days later, initial capital of $2000, and an investment of 2% of the current account net worth for each purchase. If the budget is insufficient to buy a full contract, the position is scaled according to the budget.
To perform a sensitivity analysis, the backtest was also extended to Delta 0.02, 0.05, investment ratios of 1%, 2%, 5%, and expiration days of 14, 30, and 45, resulting in a total of 54 parameter combinations.
Backtesting Method
Pricing uses Black-Scholes, assuming the risk-free interest rate is 0, and volatility is represented by the annualized volatility of the past 30 days' returns. The strike price is not arbitrarily set but is reverse-calculated from the target Delta. In terms of data, the daily samples of BTC and ETH cover up to March 14, 2026; after cleaning, BTC has 3055 records, and ETH has 3048 records, with no dates or closing prices missing that would require fixing. All skipped trades in the parameter grid result from “expiration dates exceeding the backtest end date,” with no silent failures occurring.
In other words, this conclusion is not based on a small sample or incomplete data, but on a complete historical review of BTC and ETH under the same set of rules.
Backtesting Results
First, let’s look at the benchmark portfolio, which is the closest version to the “buying deep OTM put every month” proposition itself: Delta 0.01, investing 2%, holding for 30 days.
The results are highly differentiated. BTC executed a total of 98 trades, resulting in a total return of 97.62%, with an annualized compound return rate of 8.66%; ETH also executed 98 trades, but the total return was only -73.07%, with an annualized compound return rate of -14.78%. If looking solely at the conclusion, one could say: this strategy can make money in the long run on BTC, but not on ETH.
However, what is truly notable is not the returns themselves but the cost of those returns. The maximum drawdown for the BTC benchmark portfolio reached -97.24%, while ETH also reached -93.82%. The win rate for BTC was only 2.04%, and for ETH, it was even lower at 1.02%. The median return per trade for both was -100%, with the worst trades also being -100%. This means that most of the time, this strategy doesn’t incur “small losses” but rather loses the entire premium at expiration.
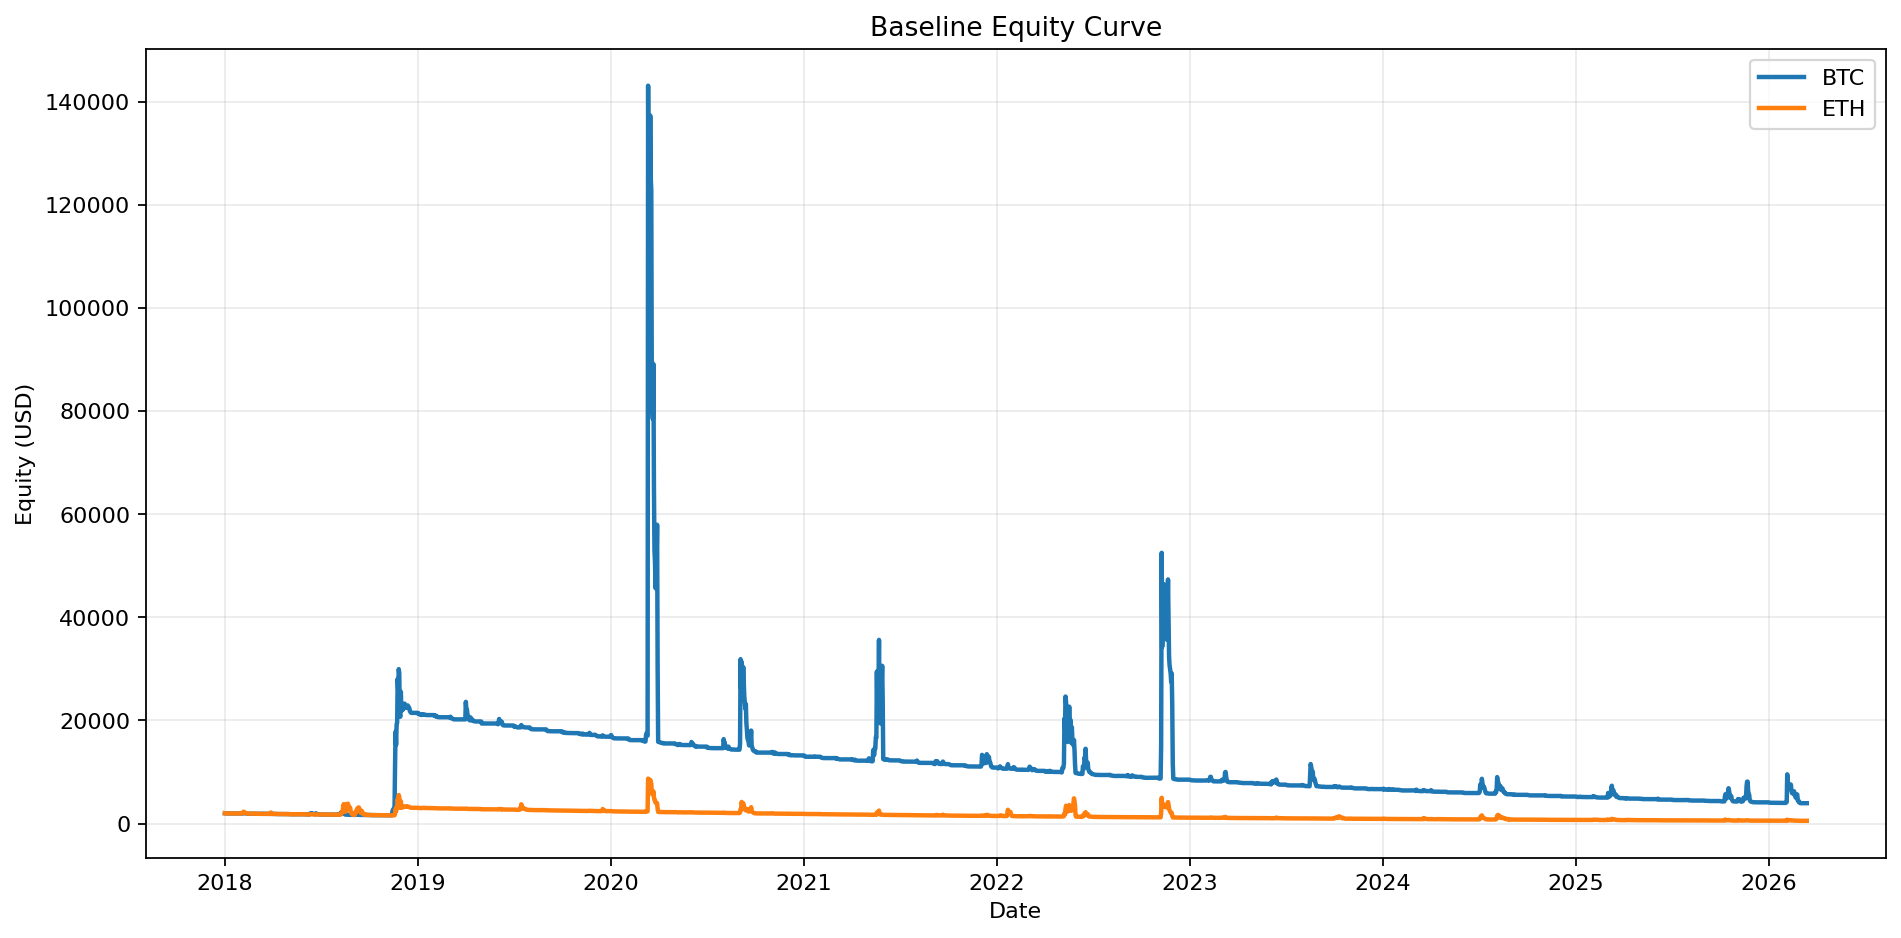
Figure 1: The capital curve of the benchmark portfolio shows that BTC and ETH's long-term results are clearly differentiated, with BTC ultimately achieving positive returns while ETH remains in a downward net worth state.
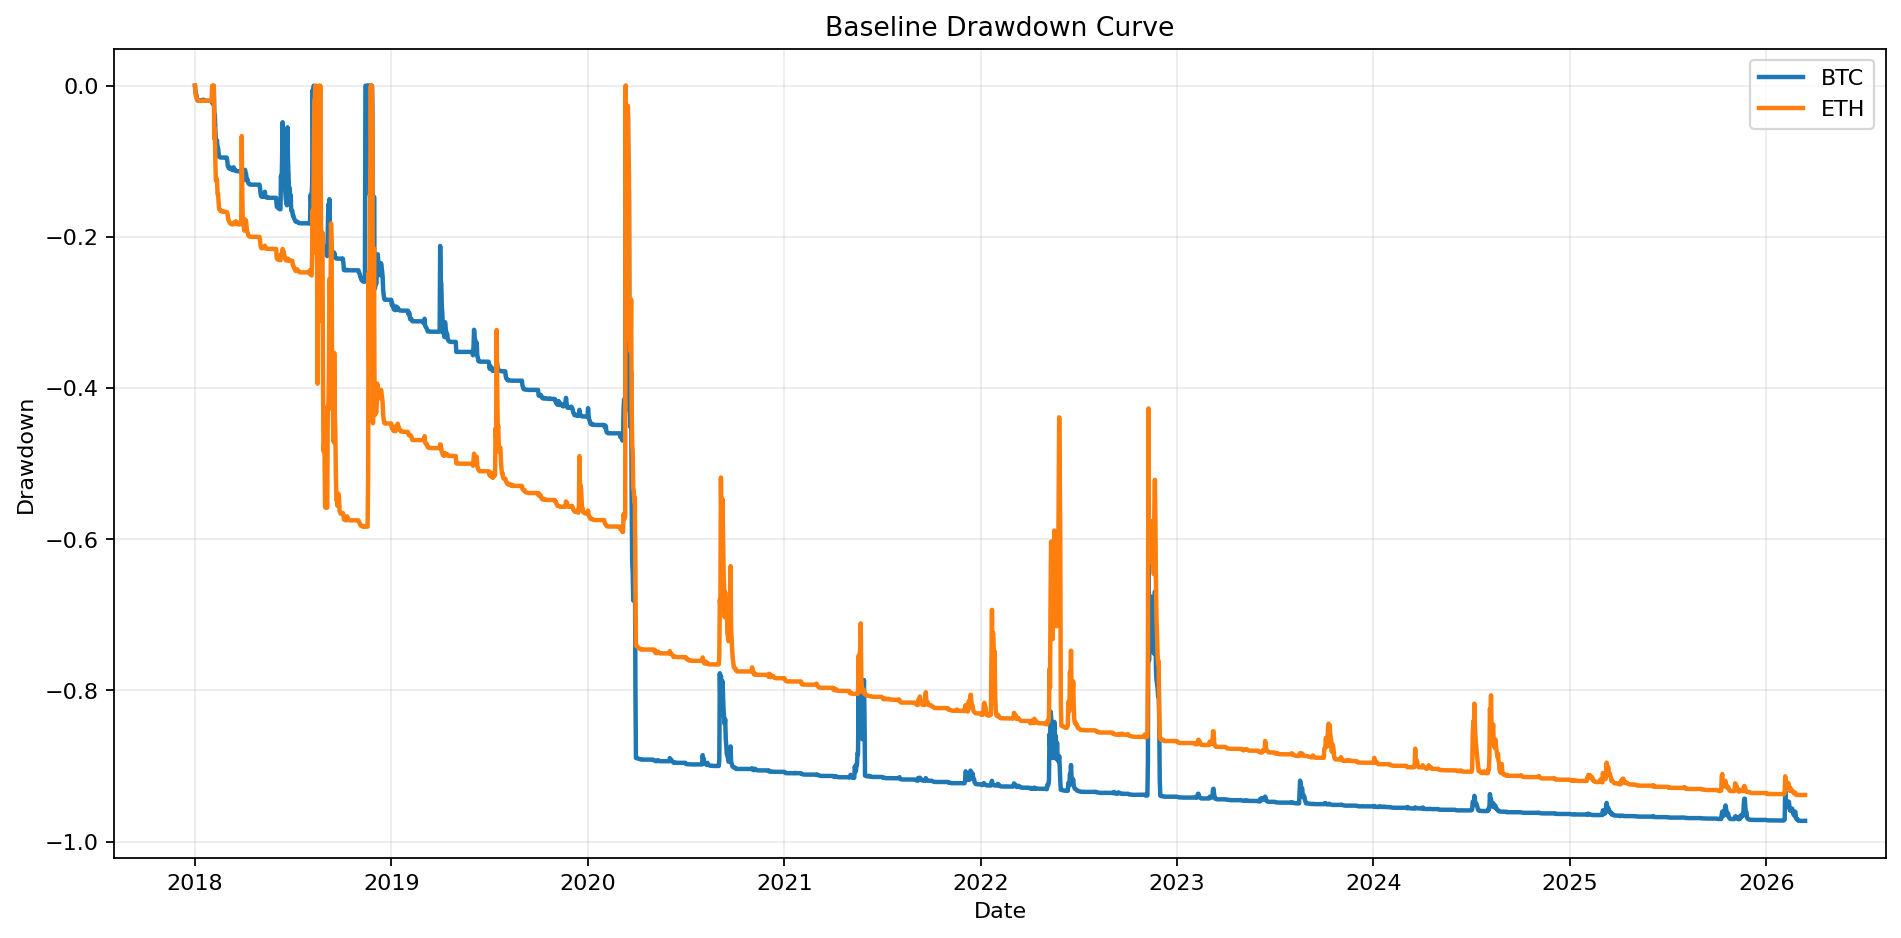
Figure 2: The drawdown curve illustrates that this type of strategy, even if it ultimately makes money, can remain deeply underwater for a long time. The maximum drawdown for the BTC benchmark portfolio reached -97.24%, while ETH was -93.82.
Visually, this point is very intuitive. The capital curve is not a smooth upward trajectory but remains long-term at a low level, occasionally pulled up by extreme profits; the drawdown curve is consistently deep underwater; and the histogram of single trade return distribution is distinctly clustered on the left at -100%, with only a few extreme large profits on the right. It is not a “win rate strategy” in the traditional sense but a typical “positive skew strategy.”
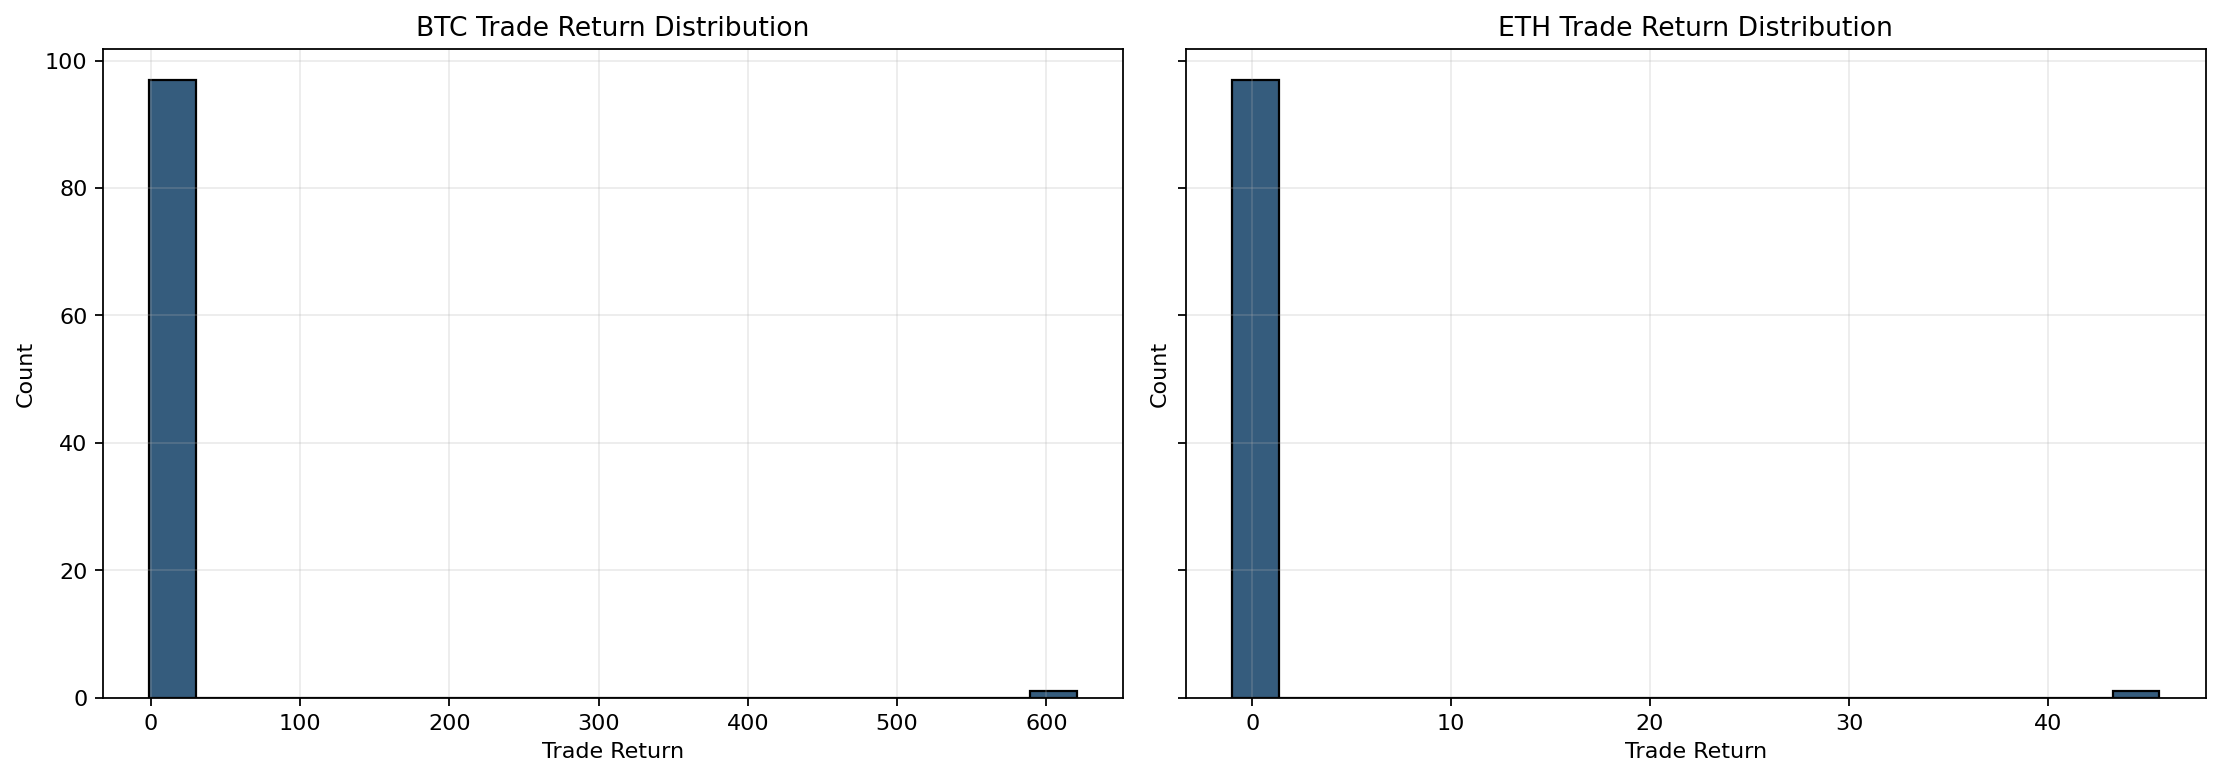
Figure 3: The distribution of single trade returns is highly right-skewed. Most months see premiums go to zero, with a few extreme profitable trades determining long-term results.
Analysis of Return Sources
The most core feature of this strategy is that returns do not come from “making money in most months,” but from “making a lot of money in a very few months.”
The proportion of profitable months for the BTC benchmark portfolio is only 4.08%, while for ETH it is only 2.04%. BTC had its longest consecutive losing months reach 57, while ETH reached 87. In other words, even if it ultimately makes money, investors may first have to endure several years of continuous losses and the feeling of strategy failure.
On the other hand, the best single trade return for the BTC benchmark portfolio is over 620 times, with the average return per trade raised to 5.36 due to extreme profits; the return distribution skewness reaches 9.90, and the kurtosis is close to 98. The top 5 profitable trades contribute 10.54 times to BTC's total net profit. These figures almost write the essence of this type of strategy on its face: it doesn’t earn money through stable carries but rather by a few extreme moments, “reimbursing” years of premiums at once.
The structure of ETH shows similar traits, but the problem is that ETH's extreme profits are insufficient to cover long-term losses. Under the benchmark portfolio, ETH paid a total premium of $2984.47 but only recovered $1523.06 at expiration, giving it a Premium Burn Ratio of 48.97%; whereas BTC paid a total of $18903.47, recovering $20855.85, resulting in a Premium Burn Ratio of -10.33%, indicating that in BTC, extreme market conditions ultimately compensated for premium losses and even yielded surplus.
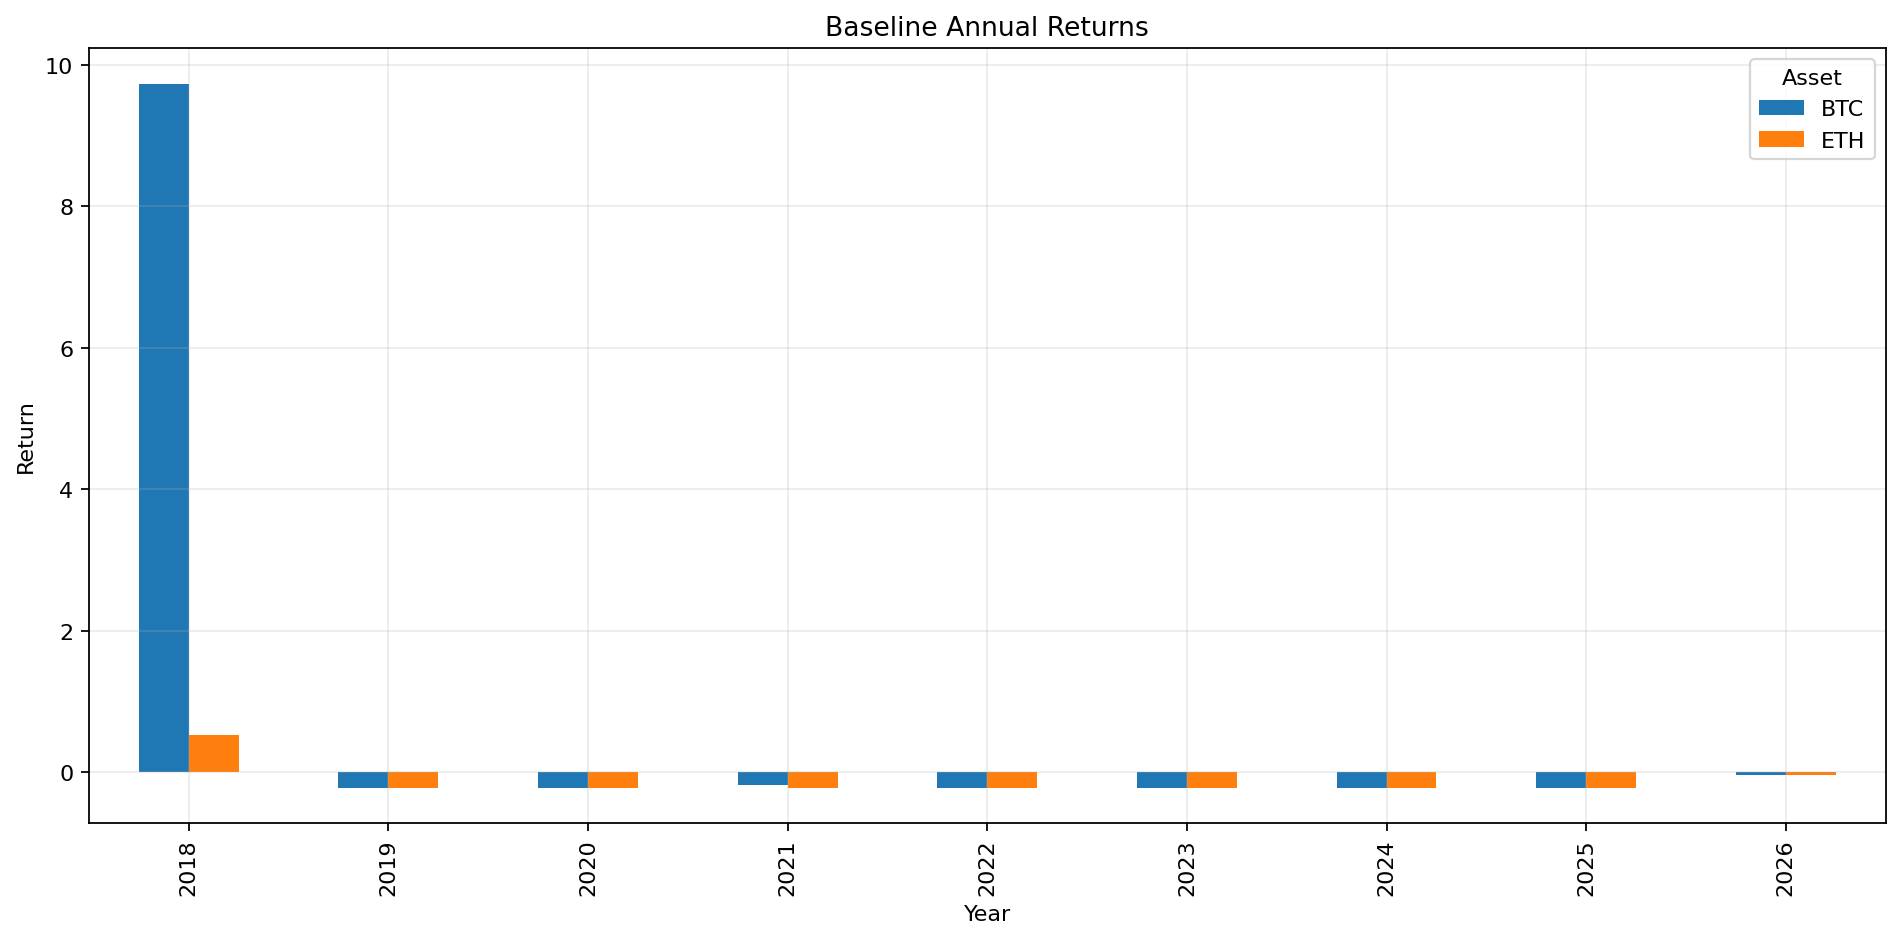
Figure 4: The contribution chart of extreme profitable trades shows that BTC's long-term profits are almost driven by a few top trades, which is typical of tail insurance strategies.
Contribution of Extreme Market Conditions to Strategy Returns
An interesting finding is that “a major market crash” does not equal “your puts definitely make money.” Under the benchmark portfolio, we closely examined the position performance around key event windows, including the pandemic crash in March 2020, the cryptocurrency crash in May 2021, the LUNA incident in May 2022, and the FTX incident in November 2022.
The results are not romantic. BTC was only profitable during the event window of May 2021, with a single trade return of 127.09%, an expiration recovery multiple of 2.27, contributing 15.87% to total net profit. The March 2020, May 2022, and November 2022 events all resulted in a 100% loss of premiums. ETH was even more extreme, experiencing 100% losses across all four event windows.
This indicates that tail insurance does not simply “automatically make money if a black swan occurs,” but highly depends on the timing of entering positions, remaining life duration, and the position of the strike price. Fixed monthly rolling purchases ensure you are “long-term present” but do not guarantee you are “holding the most profitable contract” at the right time.
Performance Differences Between BTC and ETH
From the average results across all parameter grids, BTC clearly outperforms ETH. The average total return for all parameter combinations of BTC is 1326.06%, with an average CAGR of 23.87% and an average Tail Insurance Score of 0.544; for ETH, it’s 519.48%, 13.39%, and 0.362, respectively. In the benchmark portfolio, BTC is positive while ETH is negative, and this difference is also very clear in the net worth comparison charts across different Delta and durations.
More importantly, BTC's extreme profits are more capable of covering long-term premium losses, while ETH is more likely to remain in a state of “paying premiums for the long term, with critical moments not necessarily compensating.” Simply put, while both are buying tail insurance, BTC acts more like “reliable insurance,” while ETH resembles “higher cost, harder to cash out insurance.”
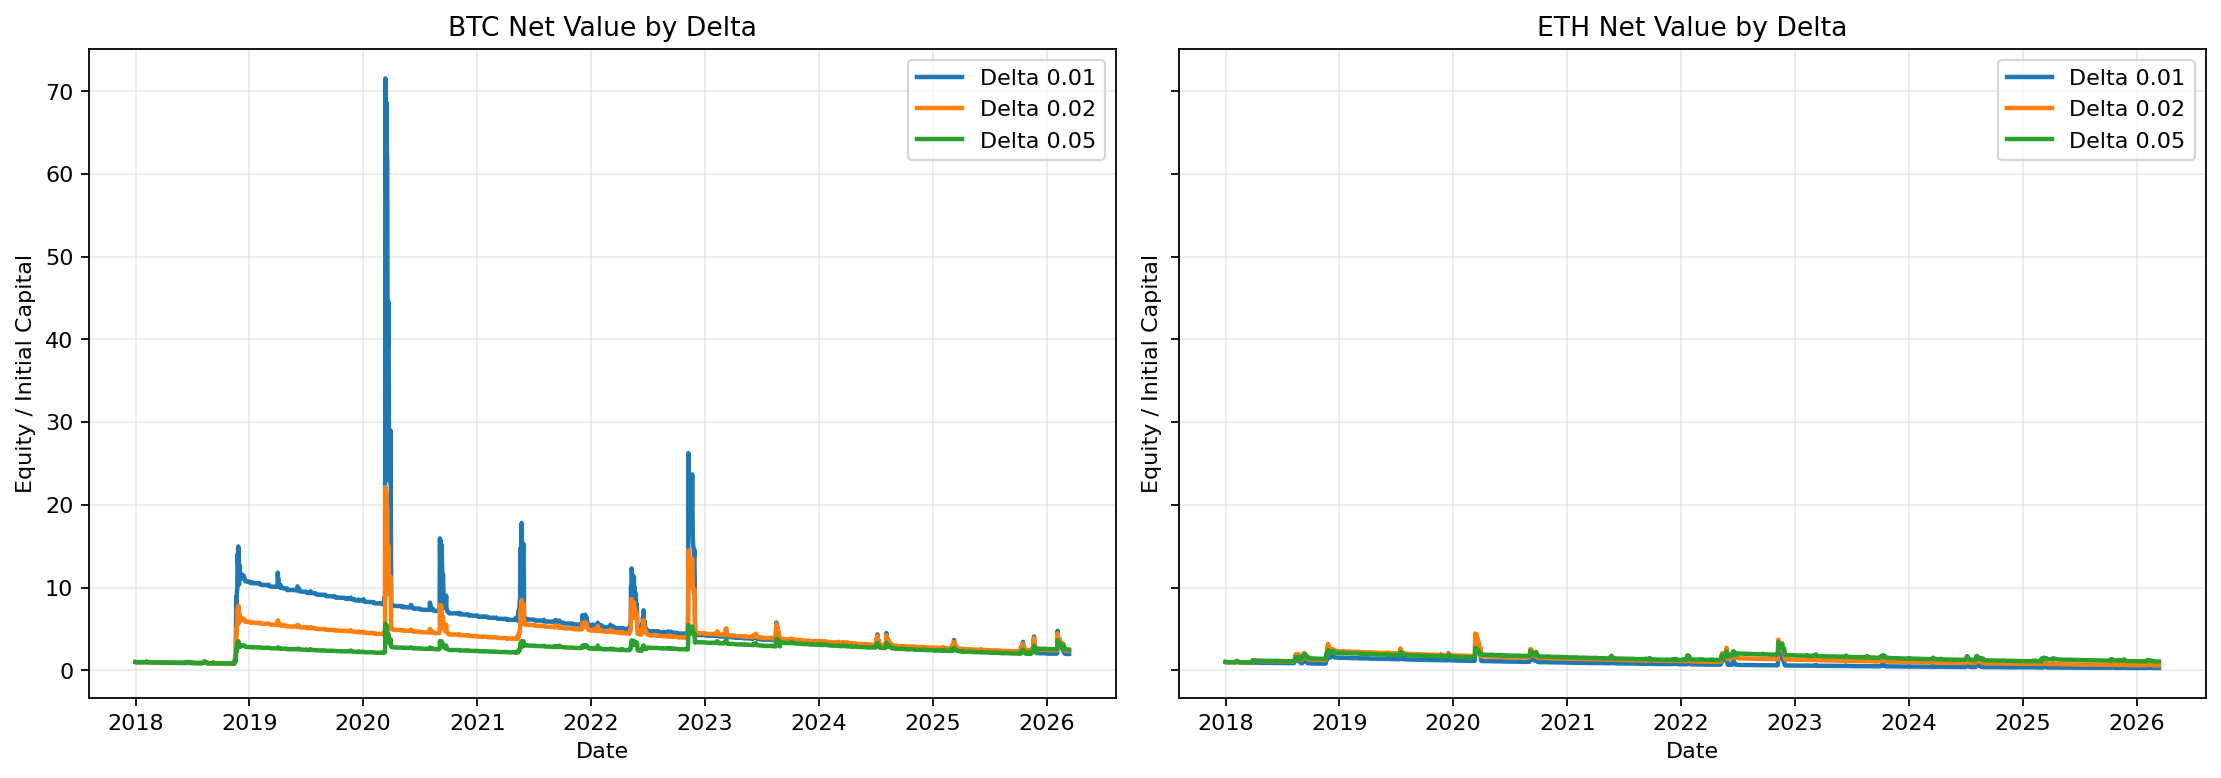
Figure 5: The comparison chart between BTC and ETH benchmark strategies shows that although both assets exhibit extreme volatility, the efficiency of BTC's tail insurance is better.
Parameter Sensitivity: Is Deeper Out-of-the-Money Better?
The parameter comparison results provide a more complete picture. Sorted by total return, the highest returning combination appears on BTC: Delta 0.01, investing 2%, with a 45-day expiration, achieving a total return of 9747.06%, corresponding to a CAGR of 74.99%. If only looking at “profitability”, deeper out-of-the-money, longer duration, and moderate leverage combinations perform extremely well on BTC.
However, when considering risk constraints, the answer becomes less simple. The combination with the lowest maximum drawdown is ETH’s Delta 0.05, 1% investment, 14-day version, with a maximum drawdown of -37.89%. Overall, looking at average indicators, Delta 0.02 provides a better balance between Total Return, Calmar Ratio, and Premium Burn Ratio, making it the most “reasonable” Delta in this entire parameter grid.
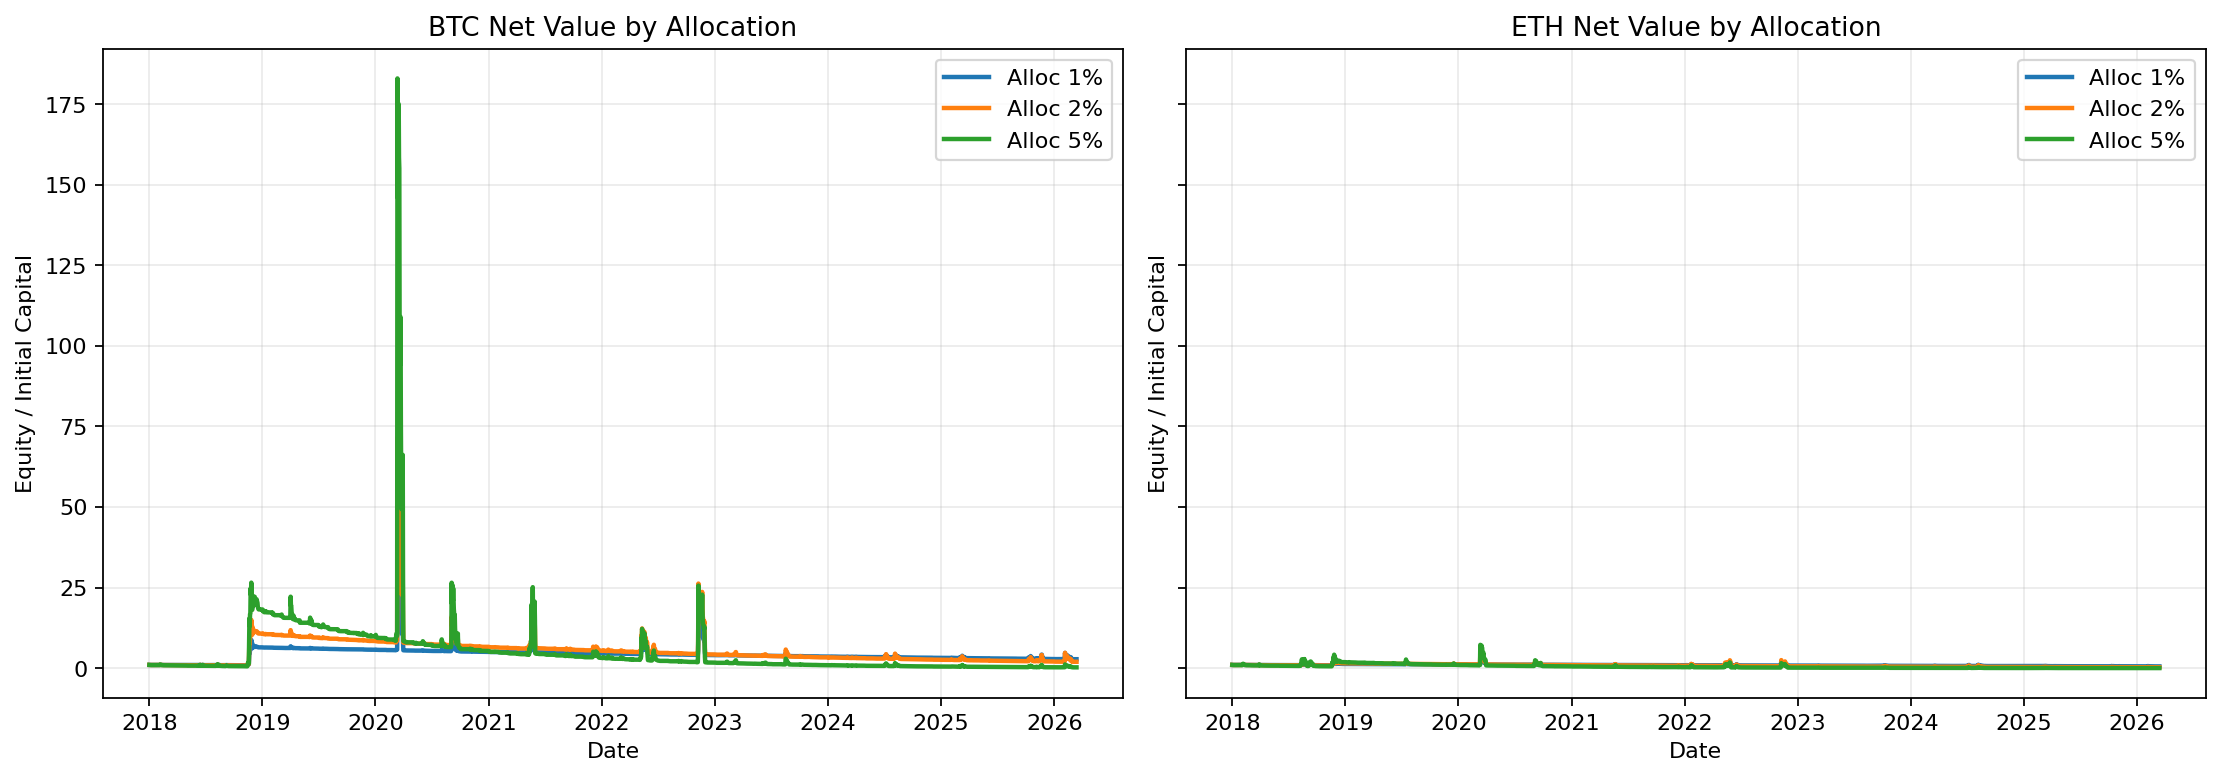
Figure 6: The net worth curves of different Deltas show that the deeper the Delta, the more the strategy resembles typical black swan insurance; when the Delta is slightly raised, a better balance appears between returns and capital experience.
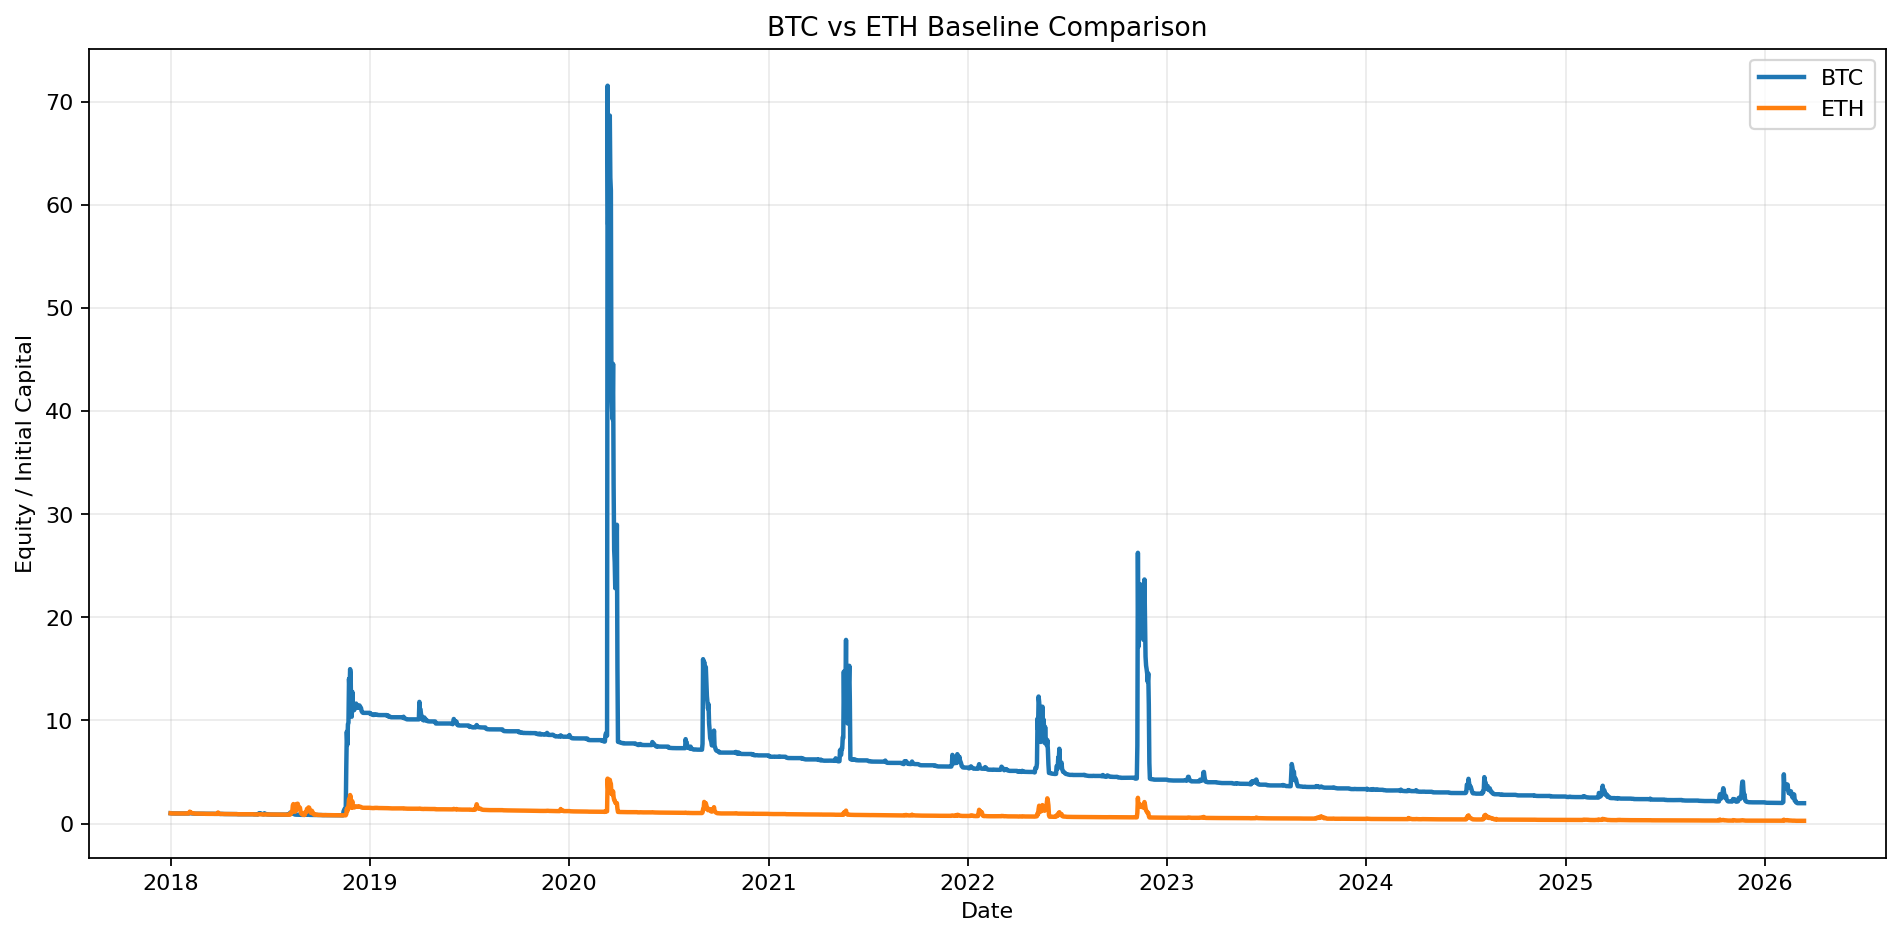
Figure 7: The comparison of different investment ratios indicates that position ratios can significantly amplify return elasticity but also simultaneously amplify long-term drawdowns and capital path risks.
Advantages and Disadvantages of the Strategy
The advantages of this type of strategy are very distinct. First, the structure is simple, the rules are fixed, and it does not rely on subjective judgment. Second, the convexity is very strong; once extreme market conditions are hit, the profit elasticity is astonishing. Third, it is entirely different from mainstream long positions logically and is more akin to a risk hedging tool within asset allocation rather than directional trading.
However, the disadvantages are equally harsh. First, the long-term capital experience is extremely poor, with low win rates, extended periods of drawdowns, and consecutive years of losses all possible. Second, it is extremely sensitive to “holding paths”; even if the market does crash, you may not necessarily hold the most profitable put at that moment. Third, while this backtest was stringent enough, it still relies on Black-Scholes and historical volatility proxies; real market factors like implied volatility skew, liquidity, fee rates, and slippage can further impact real outcomes.
What Type of Investors Is This Strategy Suitable For?
It is more suitable for three types of people. The first type is institutions that treat it as a portfolio insurance rather than a primary strategy for profit; the second type comprises highly disciplined investors who can withstand several years of “seemingly constant losses;” the third type is those who clearly wish to gain convex returns during extreme market conditions instead of pursuing high win rates daily.
It is not suitable for investors treating it as a “stable profit model,” nor for funds with short-cycle assessments that cannot tolerate long-term underwater performance. Because, based on the backtest results, even the BTC benchmark portfolio that ultimately makes money experienced a maximum drawdown of -97.24% and 57 consecutive months of losses. Without extremely strong capital tolerance, this strategy is almost impossible to maintain.
Final Conclusion
If you start buying one deep OTM put every month since 2018, can it make money in the long run? The answer from this backtest is: yes, but not in the usual sense of “yes.” For BTC, the benchmark portfolio ultimately achieved a total return of 97.62%; for ETH, the same logic resulted in a loss of 73.07%. This means that it is not a stable printing machine effective across assets and environments.
Is it a strategy purely relying on extreme market conditions? From the backtest results, essentially, yes. The extremely low win rate, very low percentage of profitable months, extremely high skewness and kurtosis, and the overwhelming contribution of the top 5 profitable trades to the final net profit all indicate that it is fundamentally not a “long-term hard-working strategy with monthly paychecks” but rather a “long-term payment of premiums waiting for a few moments of destiny” strategy.
If one must derive a more practical conclusion from these results, it is this: BTC is more suitable for this type of tail insurance; Delta 0.02 is a more balanced choice because it provides better overall cost-effectiveness in the complete parameter comparisons; and if investors pursue more extreme convexity, Delta 0.01 still represents the most aggressive and most similar version to “black swan insurance.”
Ultimately, buying deep OTM puts for the long term is neither the most expensive strategy nor the best strategy. It functions more like an expensive but irreplaceable tool in certain moments. The question is never “is it worth buying?” but rather whether you truly need this insurance and if you can withstand the long years before the actual claims arrive.
免责声明:本文章仅代表作者个人观点,不代表本平台的立场和观点。本文章仅供信息分享,不构成对任何人的任何投资建议。用户与作者之间的任何争议,与本平台无关。如网页中刊载的文章或图片涉及侵权,请提供相关的权利证明和身份证明发送邮件到support@aicoin.com,本平台相关工作人员将会进行核查。


