Author: Coingecko
Compiled by: Felix, PANews
After experiencing turbulence at the end of 2025, Bitcoin continued to decline in early 2026. At the same time, geopolitical and macroeconomic events drove up the prices of gold, silver, and more recently, crude oil. As cryptocurrencies continue to be embraced as an asset class, many Wall Street investors may be experiencing their first crypto bear market. Coingecko examines the performance of cryptocurrencies relative to other traditional asset classes at the start of 2026.
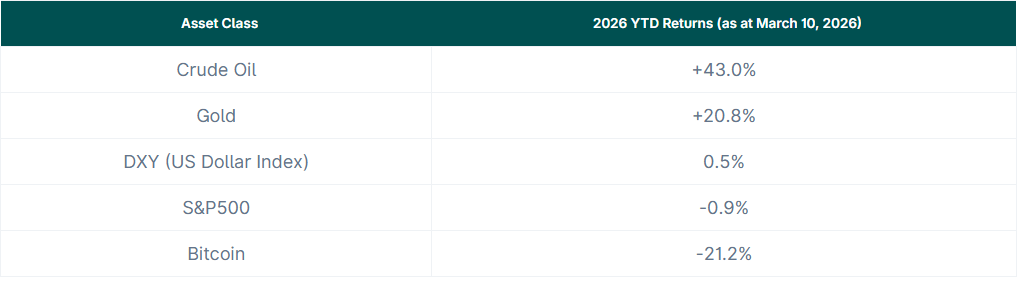
As the war in Iran broke out, crude oil prices surged faster than all other asset classes in 2026.
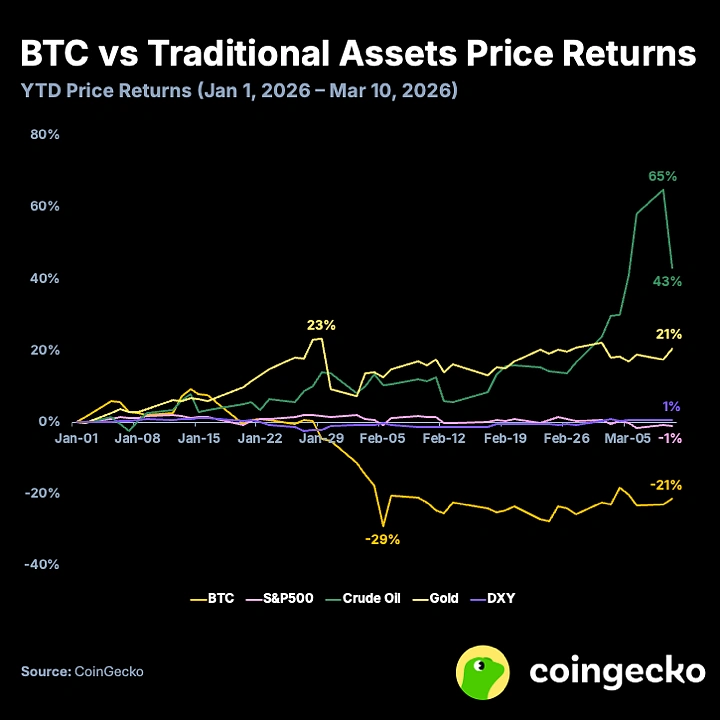
Since the beginning of 2026, crude oil prices have been slowly rising due to escalating tensions in the Middle East and a critical shortage in market supply. However, the situation peaked when the United States and Israel launched the latest attacks on Iran on February 28. The intraday price of crude oil reached as high as $119.48, while the price at the beginning of the year was only $57.41.
Meanwhile, Bitcoin's price continued to decline in 2026, becoming the worst-performing asset class to date. However, since early March, Bitcoin seems to have found support between $65,000 and $75,000, after previously dropping to a low of $62,800 in early February. The U.S. spot Bitcoin ETF has seen strong inflows since the end of February (with a net inflow of $1.9 billion since February 20, but still experiencing an outflow of $828.9 million year-to-date), while strategies continue their consistent buying pace, having invested $5.6 billion since the beginning of the year.
Year-to-date in 2026, cryptocurrencies have shown only moderate correlation with the S&P 500 and gold, perhaps signaling the eventual "decoupling" of asset classes.
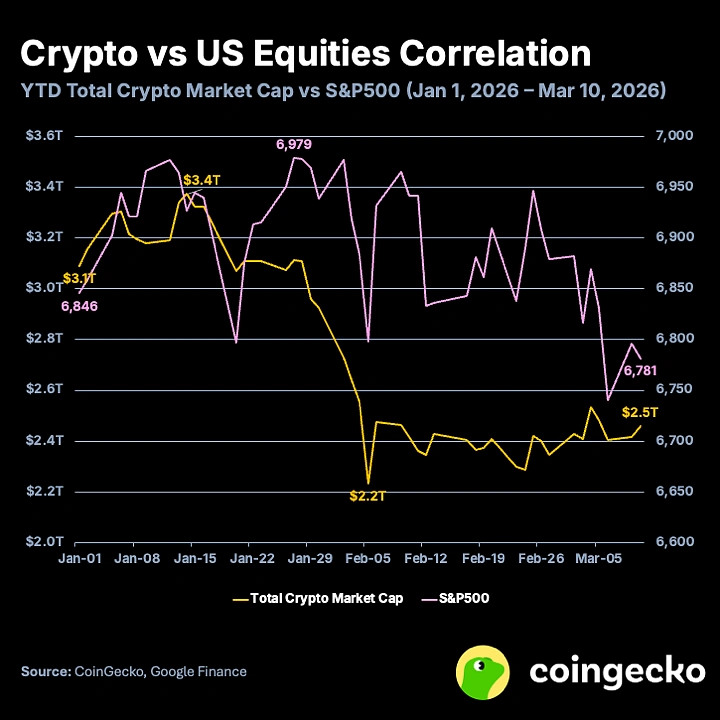
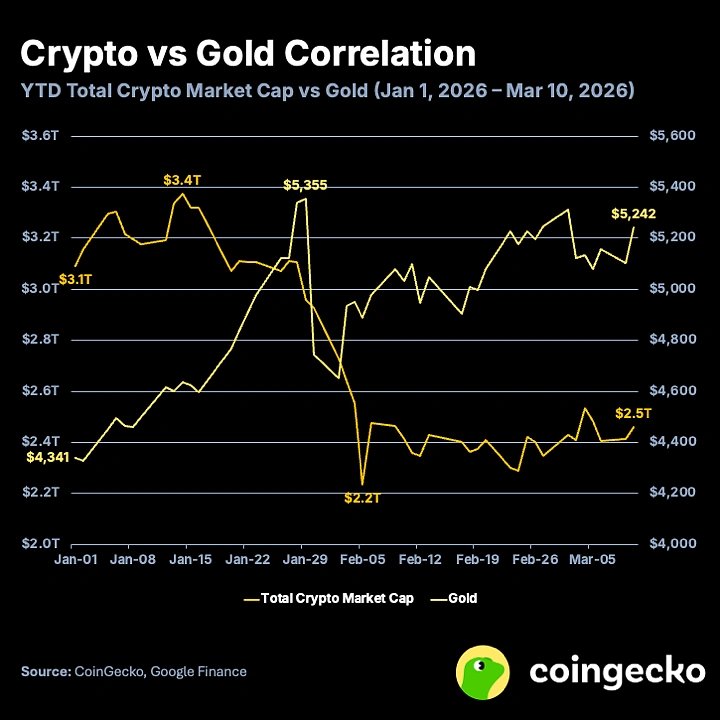
Since the beginning of the year, the correlation between the total market capitalization of cryptocurrencies and the S&P 500 index has been 0.49, indicating a moderate positive correlation, similar to the situation in 2025 (when the annual correlation was 0.46). On the other hand, the correlation between cryptocurrencies and gold has shifted to -0.69 year-to-date, indicating a moderate negative correlation. The correlation between cryptocurrencies and gold in 2025 was only 0.19, showing weak or no correlation. Overall, cryptocurrencies as an asset class are beginning to shed the inherent perception of being purely a risk asset as they decouple from U.S. stocks.
U.S. stocks, represented by the S&P 500 index, also face significant resistance in 2026. Despite increased investment in the AI sector and generally strong economic and earnings report data, the index has actually declined since the beginning of the year. Geopolitical tensions have undoubtedly played a role, but the ongoing uncertainty surrounding AI's impact on the future economy and workforce has also sparked fears of an "end of SaaS" scenario. Since the beginning of the year, the market capitalization of publicly traded software and SaaS companies has evaporated by $1.3 trillion to $1.5 trillion, accompanied by a sharp decline in forward price-to-earnings ratios and revenue multiples.
In addition, gold has continued its strong momentum since 2024, with a year-to-date increase of over 20%. Gold is typically viewed as a stable store of value and a safe-haven asset, but its prices have shown higher volatility due to skyrocketing values. Ongoing geopolitical and macroeconomic pressures continue to drive its upward momentum, with retail traders and sovereign nations buying in.
Related reading: BTC Options Insights: Why March 20 is a Key Turning Point for Volatility?
The performance of 2026 is starkly different from that of 2024; for reference, here is the performance of Bitcoin against other asset classes in 2024 (published in December 2024).
Known as the "magical internet currency," Bitcoin may have become a legitimate investment asset alongside traditional assets like stocks, commodities, and bonds. Considering the 10-year return rate, Bitcoin boasted an astonishing return of 26,931.1%. Imagine that $100 invested in 2014 is now worth $26,931.1. While these figures are impressive, it is equally important to examine its performance relative to other assets in the short and long term.
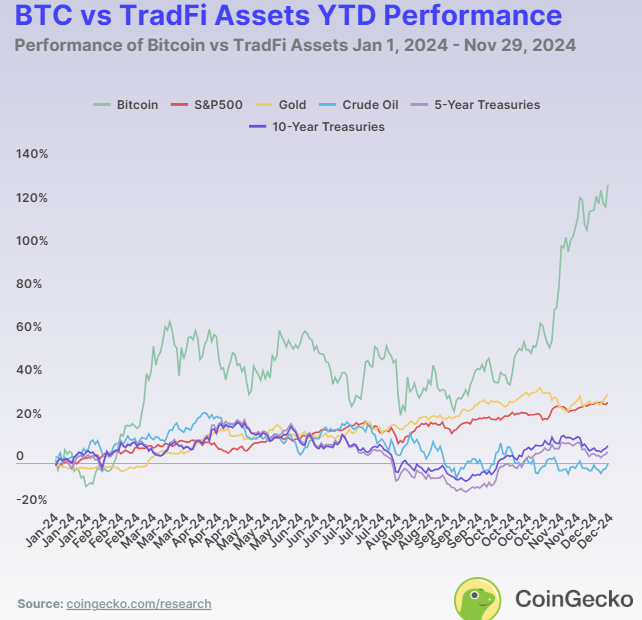
Which asset performed best year-to-date, over 1 year, 3 years, 5 years, and 10 years?
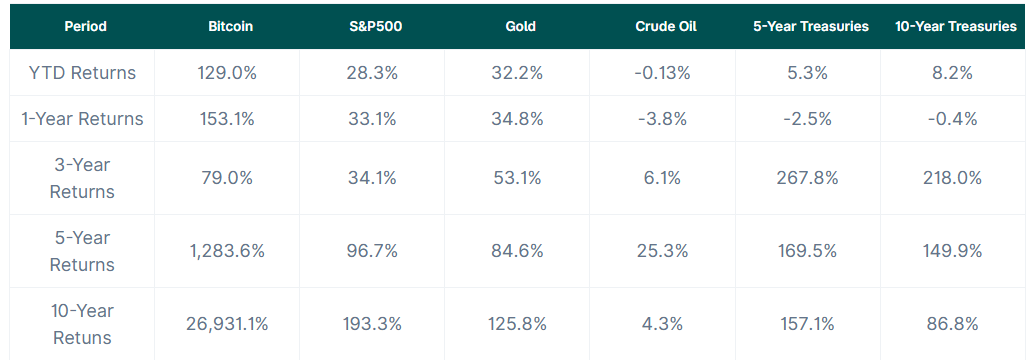
The performance over different time spans reveals the strengths and weaknesses of each asset. In 2024, Bitcoin was the best-performing asset with a return of 129.0%. Gold followed closely with a year-to-date return of 32.2%, demonstrating its reliability as a traditional store of value. The S&P 500 index remained strong with a return of 28.3%. However, crude oil prices fell, resulting in a return of -0.13%, while U.S. Treasuries provided moderate returns, with the 5-year Treasury at 5.3% and the 10-year Treasury slightly higher at 8.2%.
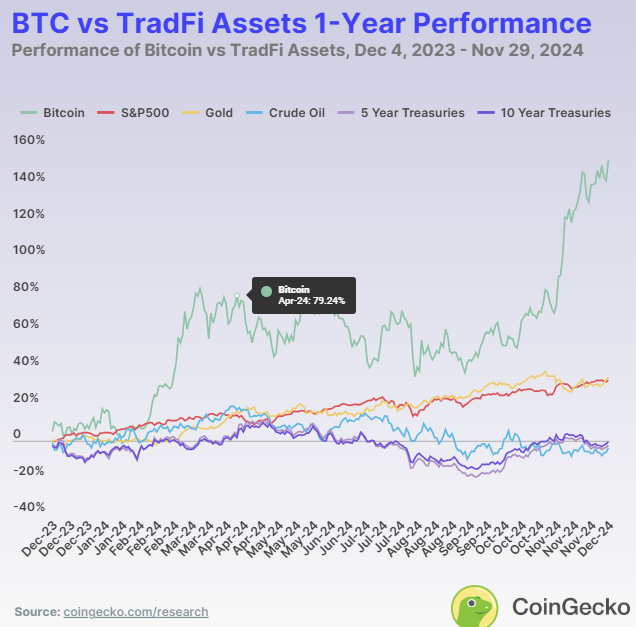
From a one-year perspective, Bitcoin's performance continued to outperform other assets with a return of 153.1%. Gold's return was 34.8%, followed by the S&P 500's 33.1%. The strong performance of these three asset classes reflects market stability over the past year. However, Treasuries were more sensitive to economic changes, with 5-year and 10-year bond returns of -4.3% and -2.6%, respectively. These figures show how bonds fluctuate with interest rates and fiscal policies.
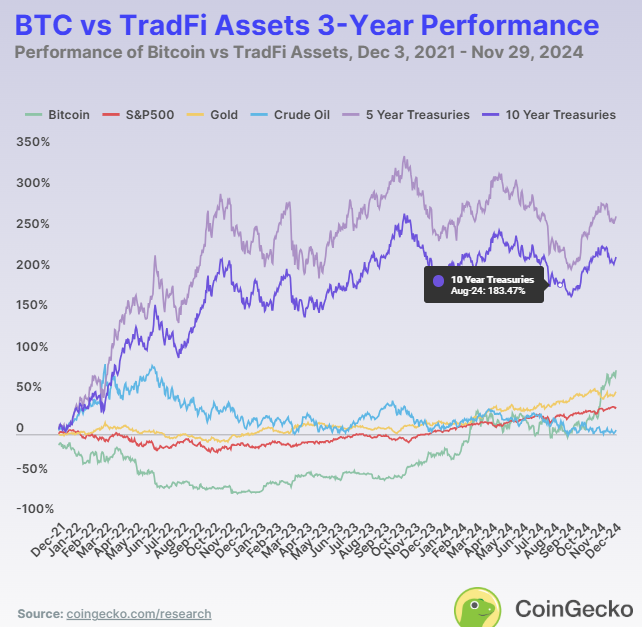
In the three-year range, the market performance pattern shifted, favoring bonds as economic stability became increasingly important. Among them, U.S. Treasuries led with a 267.8% return for 5-year bonds, followed closely by 10-year bonds at 218%. Bitcoin also performed excellently during the same period, with a return of 79%, while gold remained strong with a solid return of 53.1%, providing some security amid market uncertainty. Crude oil was the only asset that performed worse than others during this time, with a return of only 6.1%.
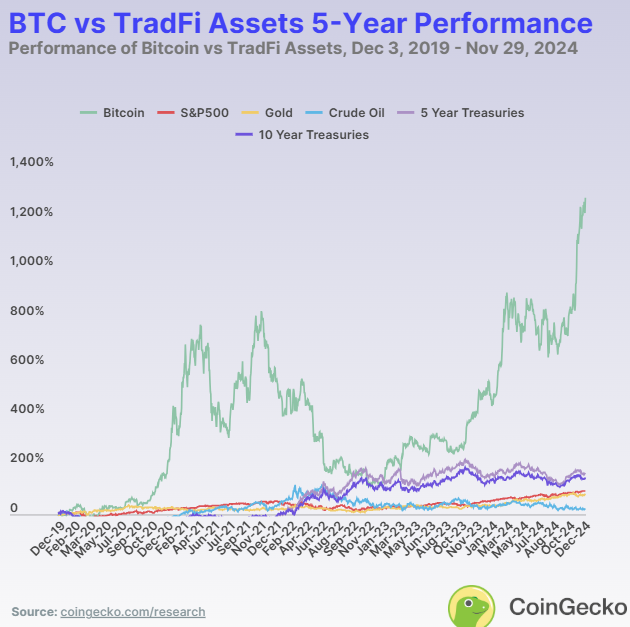
The five-year data shows Bitcoin performed the strongest, with a return of 1283.6%. The S&P 500 index and gold remained steady, with returns of 96.7% and 84.6%, respectively. U.S. Treasuries also performed well, with 5-year bonds yielding 157.1% and 10-year bonds yielding 149.9%. Crude oil prices rose only 25.3%, showing relatively low appeal for long-term investment. Data during this period indicates Bitcoin has tremendous potential returns for medium-term investments, while the steady growth of stocks and gold balances this out.
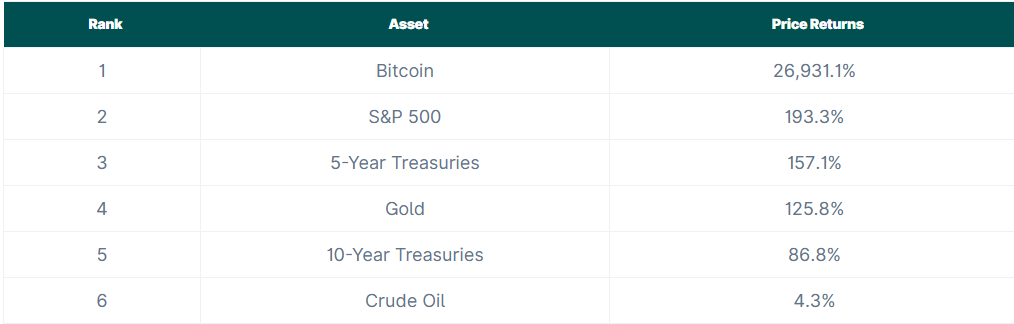
From a ten-year perspective, Bitcoin's growth rate reached 26,931.1%, unmatched by any other asset, proving its immense investment potential for early investors. Although returns from other assets are far inferior to Bitcoin's, they can still provide stable yields, such as the S&P 500's return of 193.3% and gold's return of 125.8%. U.S. Treasuries also maintained their value, with a 5-year Treasury's return of 157.1% and a 10-year Treasury's return of 86.8%. However, crude oil's return was only 4.3%, considerably lagging behind other assets.
This ten-year observation indicates that Bitcoin is the ultimate high-growth asset, while gold, bonds, and stocks offer safer, lower-return alternatives for risk-averse investors. Nevertheless, Bitcoin was still a relatively new asset at the time, with a market capitalization far smaller than that of other assets. It is precisely due to its smaller base that it was able to grow at a faster rate.
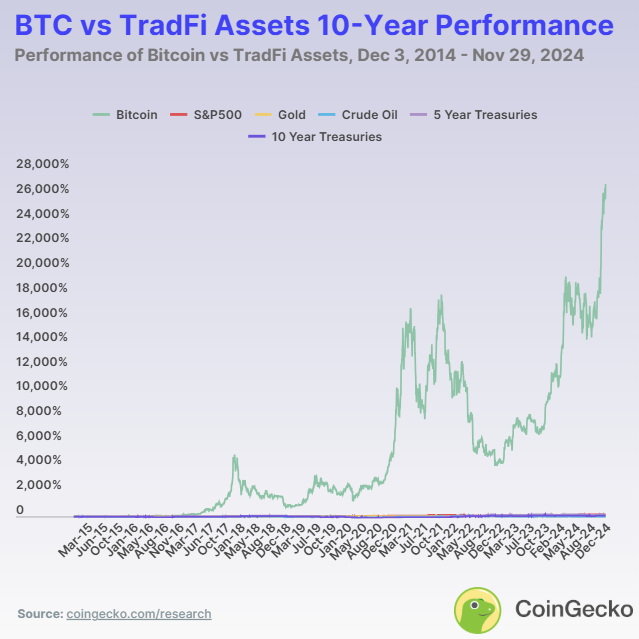
Has Bitcoin experienced significant volatility over the past decade?
Bitcoin's enormous price increases over the past decade have been accompanied by significant volatility. The price of Bitcoin has dipped as low as $172.15 and surged to as high as $103,679. The following chart clearly illustrates Bitcoin's cycles, coincidentally occurring every four years after halving. During this decade, Bitcoin has experienced two "bull markets," which took place in 2017-2018 and 2020-2021, and is currently in one of these bull market cycles. Towards the end of these cycles, Bitcoin prices often plummet to below 70% of their peak, leading to significant volatility. This extreme volatility highlights the high-risk, high-reward nature that is highly attractive to growth-seeking investors but presents challenges for those seeking stability.
Is Bitcoin's performance related to other assets?
In addition to volatility, the relationship between Bitcoin and other major assets like the S&P 500 index and gold can further reveal its unique behavior. Correlation analysis shows how Bitcoin remains synchronized with or decoupled from traditional markets:
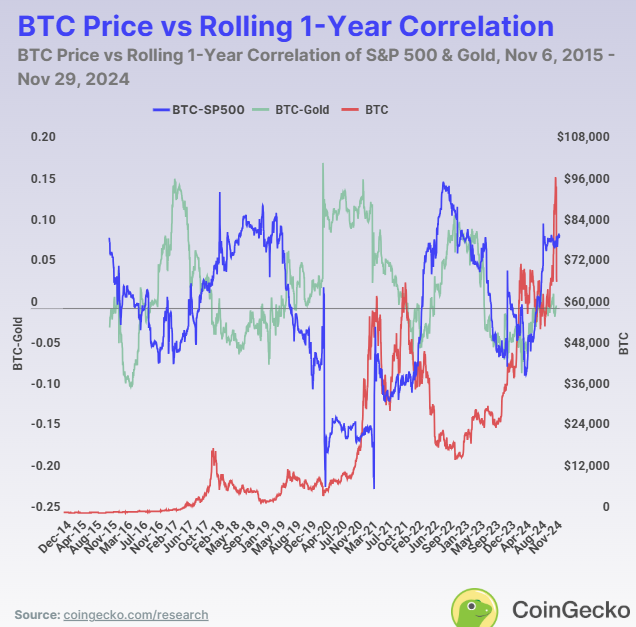
Bitcoin and the S&P 500 Index
Over the years, Bitcoin's correlation with the S&P 500 index (shown by the blue line) has not been stable, typically hovering near zero before 2018. This low correlation indicates that Bitcoin's behavior during this period was largely independent of the stock market. However, since 2020, this correlation has increased, with Bitcoin's behaviors aligning more closely with stocks during significant economic events like the COVID-19 pandemic. Price correlations have also coincided with Bitcoin's rallies in 2018, 2020, and 2024.
Bitcoin and Gold
In terms of gold, Bitcoin's correlation shows an inverse relationship with its correlation to the S&P 500. This indicates that while both are regarded as alternative investments, Bitcoin and gold (shown by the green line) tend to move independently of each other. Moreover, the correlation inversely moves with Bitcoin's price. As prices rise, correlation decreases and vice versa. This suggests that when Bitcoin performs poorly, investors tend to shift toward gold investments. Nevertheless, during macroeconomic events, correlation often spikes briefly, reflecting both assets' responses to similar market conditions. Despite this, Bitcoin has not yet fully established its status as "digital gold."
The ten-year price return comparisons between Bitcoin and traditional assets are as follows:
免责声明:本文章仅代表作者个人观点,不代表本平台的立场和观点。本文章仅供信息分享,不构成对任何人的任何投资建议。用户与作者之间的任何争议,与本平台无关。如网页中刊载的文章或图片涉及侵权,请提供相关的权利证明和身份证明发送邮件到support@aicoin.com,本平台相关工作人员将会进行核查。


