Wave Riding in the Crypto Sea: 3.18 Bitcoin (BTC) Market Analysis Reference:
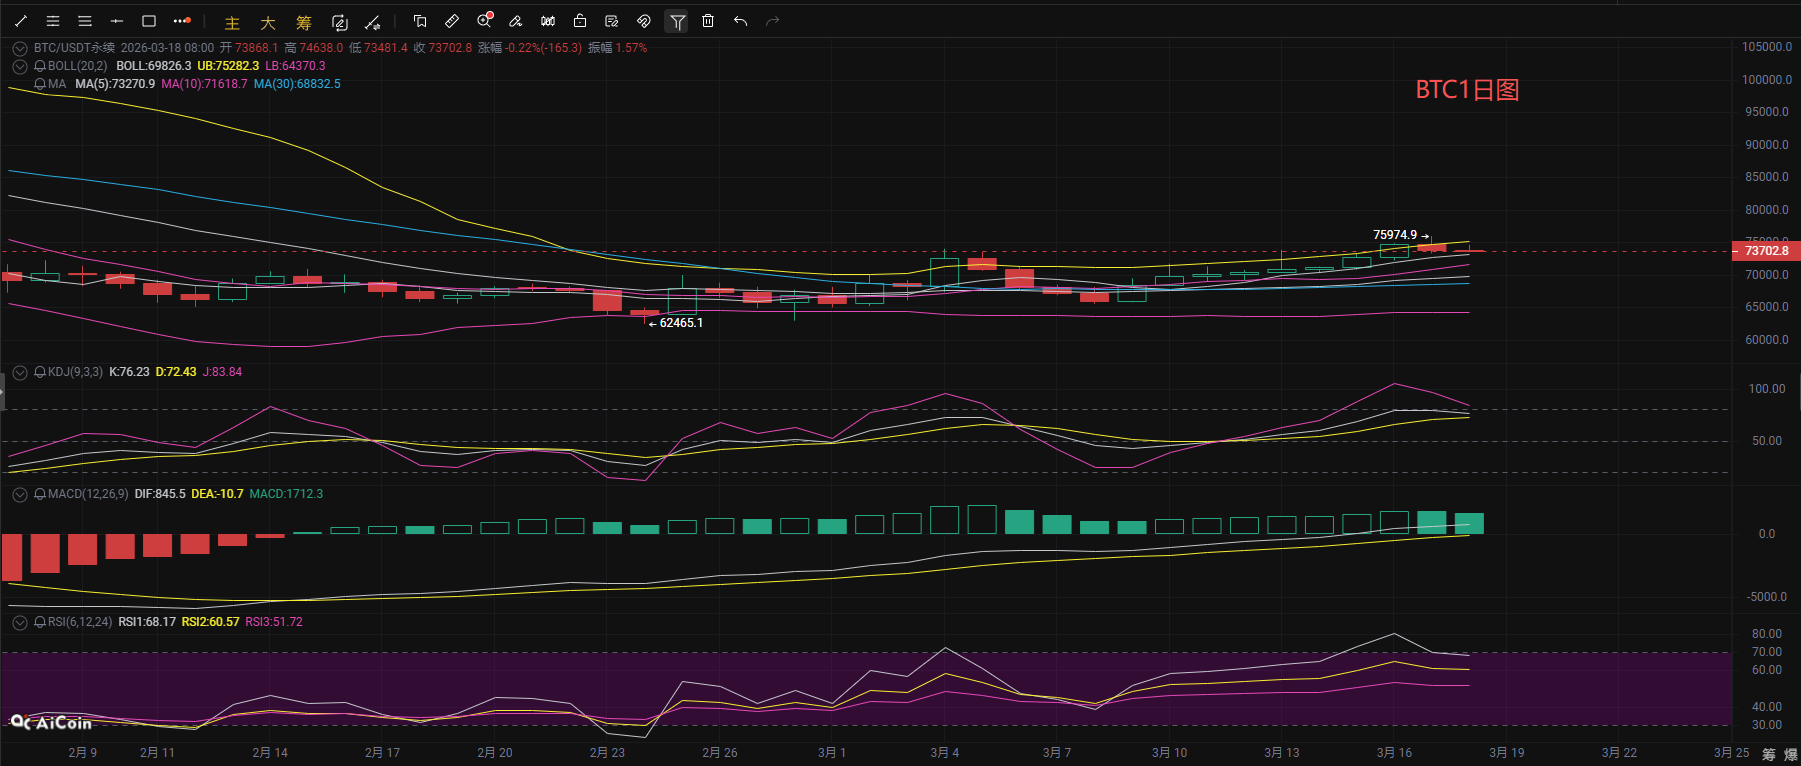
Bitcoin spiked yesterday before pulling back, subsequently entering a high-level consolidation phase. During the day, the price oscillated within a range, with the bullish momentum gradually slowing down. From a daily chart perspective, the price holds steady above the MA5, MA10, and MA30 lines, with the moving averages in a bullish arrangement, indicating that the medium-term upward trend remains solid; both KDJ and RSI indicators are in the high strong zone, reflecting an optimistic market sentiment, but at the same time showing signs of being overbought; in the MACD indicator, the DIF and DEA maintain upward divergence, and the core bullish momentum has not been destroyed. Overall, the medium-term upward pattern remains intact, but the overbought configuration indicates a risk of pullback in the short term. Attention should be focused on the support in the 73000-73500 range, as the gains or losses in this area will determine the short-term trend. It is not advisable to blindly chase higher prices.
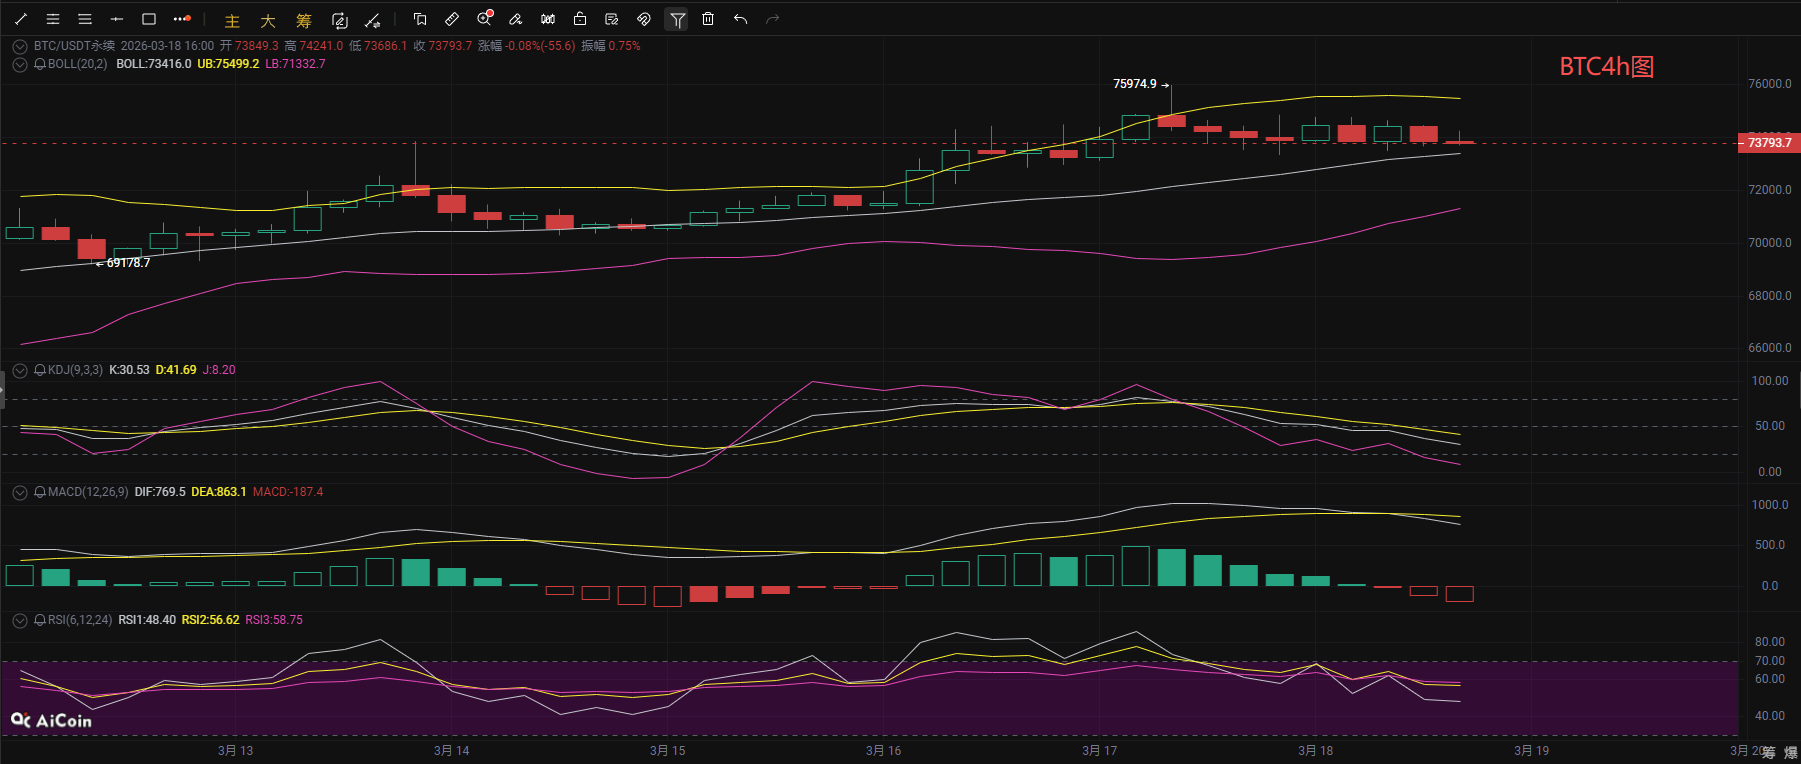
From the short-term hourly chart perspective, on the 4-hour chart, Bitcoin price is running above the middle band of the Bollinger Bands, still in a high-level oscillation range. The KDJ indicator's J value has fallen to a low level, while the K and D values are both moving downward. The MACD has shifted from positive to negative, with the DIF crossing below the DEA forming a death cross, indicating released short-term pullback sentiment, and the bullish momentum is gradually weakening; on the hourly level, the price oscillates around the middle band of the Bollinger Bands, with increasing tug-of-war between bulls and bears. The KDJ shows a low turning point, and the MACD green bars are slightly expanding, showing that the bearish momentum has not completely dissipated. In summary, short-term prices are likely to oscillate within the 73500-74800 range, with future focus on the 4-hour Bollinger Bands middle band support near 73475. If it breaks below, it may further test the 72500-73000 range for stronger support. I suggest all coin friends operate cautiously and prepare risk control in advance!
Wave Riding in the Crypto Sea: 3.18 Bitcoin Short-term Reference:
Short position: Sell in the range of 74800-75800, stop loss 500 points, target look for 74500-73500-72500,
Long position: Buy in the range of 72000-73000, stop loss 500 points, target look for 73500-74500,
Wave Riding in the Crypto Sea: 3.18 Ethereum (ETH) Market Analysis Reference:
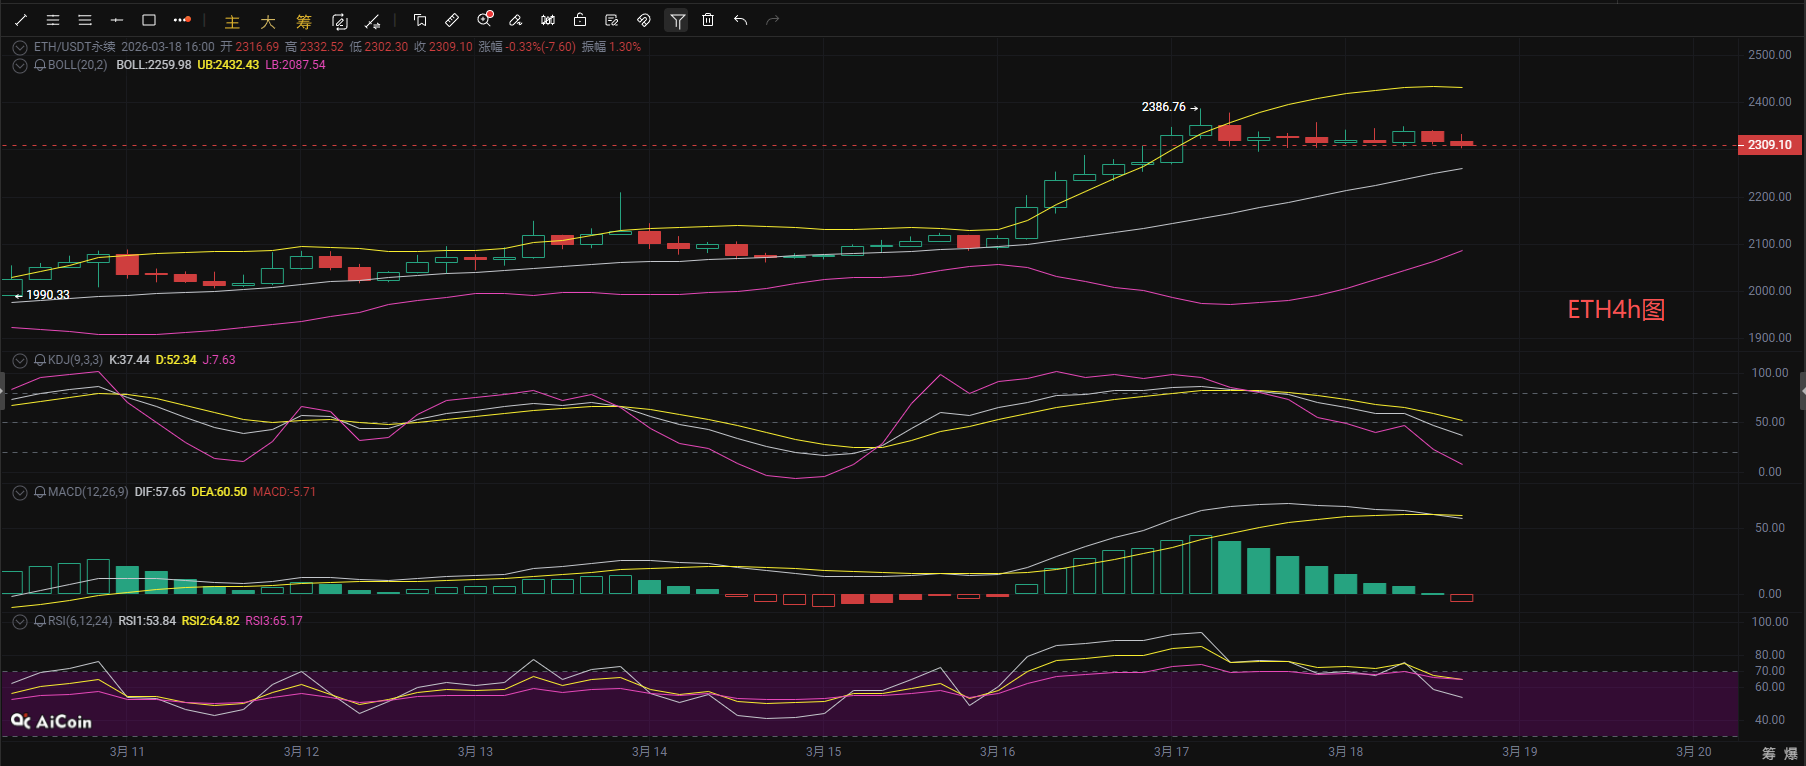
Ethereum's intra-day trend is quite similar to that of Bitcoin. Looking at the 4-hour chart, Ethereum's price is oscillating at a high level above the middle band of the Bollinger Bands. The MACD indicator's DIF crossed below the DEA forming a death cross, with bullish momentum weakening. The KDJ J value has fallen to a low level, and the RSI has retreated from the high strong zone, showing short-term pullback signals; on the hourly chart, the price has retracted to the lower band of the Bollinger Bands, with the MACD lines approaching the zero axis from the downside. The KDJ is at a low level, and the RSI has fallen into the weak zone, indicating further release of bearish sentiment. In summary, Ethereum remains in a pullback consolidation phase, with a focus on support near the 4-hour Bollinger Bands middle band around 2260. If it effectively breaks below, it may further test lower levels.
Wave Riding in the Crypto Sea: 3.18 Ethereum Short-term Reference:
Short position: Sell in the range of 2355-2395, stop loss 30 points, target look for 2300-2250,
Long position: Buy in the range of 2225-2255, stop loss 30 points, target look for 2300-2350,
[The above analysis and strategies are for reference only. Please bear the risks. The article may have delays in review and publication, and strategies may not be timely. Do not operate blindly.]

This article content is originally shared by [Wave Riding in the Crypto Sea], representing personal views only. The article may have delays in sending and is for reference only. Please do not operate blindly! If you want to receive more daily real-time signals, then follow my public account! Here, you can engage in online technical learning on the market and understand relevant knowledge for unlocking and exiting. I have many years of research experience in the market, focusing on the major trends in the cryptocurrency circle. Mainly responsible for analyzing and guiding investment operations in BTC, ETH, DOT, LTC, FIL, EOS, BCH, ETC, and other coins. Welcome to study and research together.
免责声明:本文章仅代表作者个人观点,不代表本平台的立场和观点。本文章仅供信息分享,不构成对任何人的任何投资建议。用户与作者之间的任何争议,与本平台无关。如网页中刊载的文章或图片涉及侵权,请提供相关的权利证明和身份证明发送邮件到support@aicoin.com,本平台相关工作人员将会进行核查。