Welcome to Qinglan Crypto Class, I am Sister Qinglan. Let's get straight to the point:
Today we will continue to analyze from four timeframes, all straightforward talk:
Step One: Trend Determination
Let's look from big to small!
Daily timeframe: The trend is "bullish arrangement"! MA5 is above MA10 and MA30, the pattern is still upward. The key resistance level is around 76000, which is the previous high. As for the support level, look at around 71000. However, even though the moving averages are bullish, the price has fallen from above 74800, indicating a lack of upward momentum. The on-chain data shows a fear and greed index of only 26, indicating a "fear" status; the news is filled with hawkish messages from the Federal Reserve and Powell's hawkish statements, creating a panic that casts a shadow over the daily bullish trend and makes bulls hesitant to push hard.
4-hour timeframe: The trend is "moving averages intertwined", MA5, MA10, MA30 are nearly twisted together, a typical oscillation pattern! The resistance level is around 74500-75000, the support level is around 71500. You can see the price fluctuating back and forth between 71000 and 75000. The news says BlackRock is buying BTC like crazy, which counts as a supportive message, but it can't resist the macro hawkish pressure, so the 4-hour level is stuck in this large range, neither up nor down, very tangled.
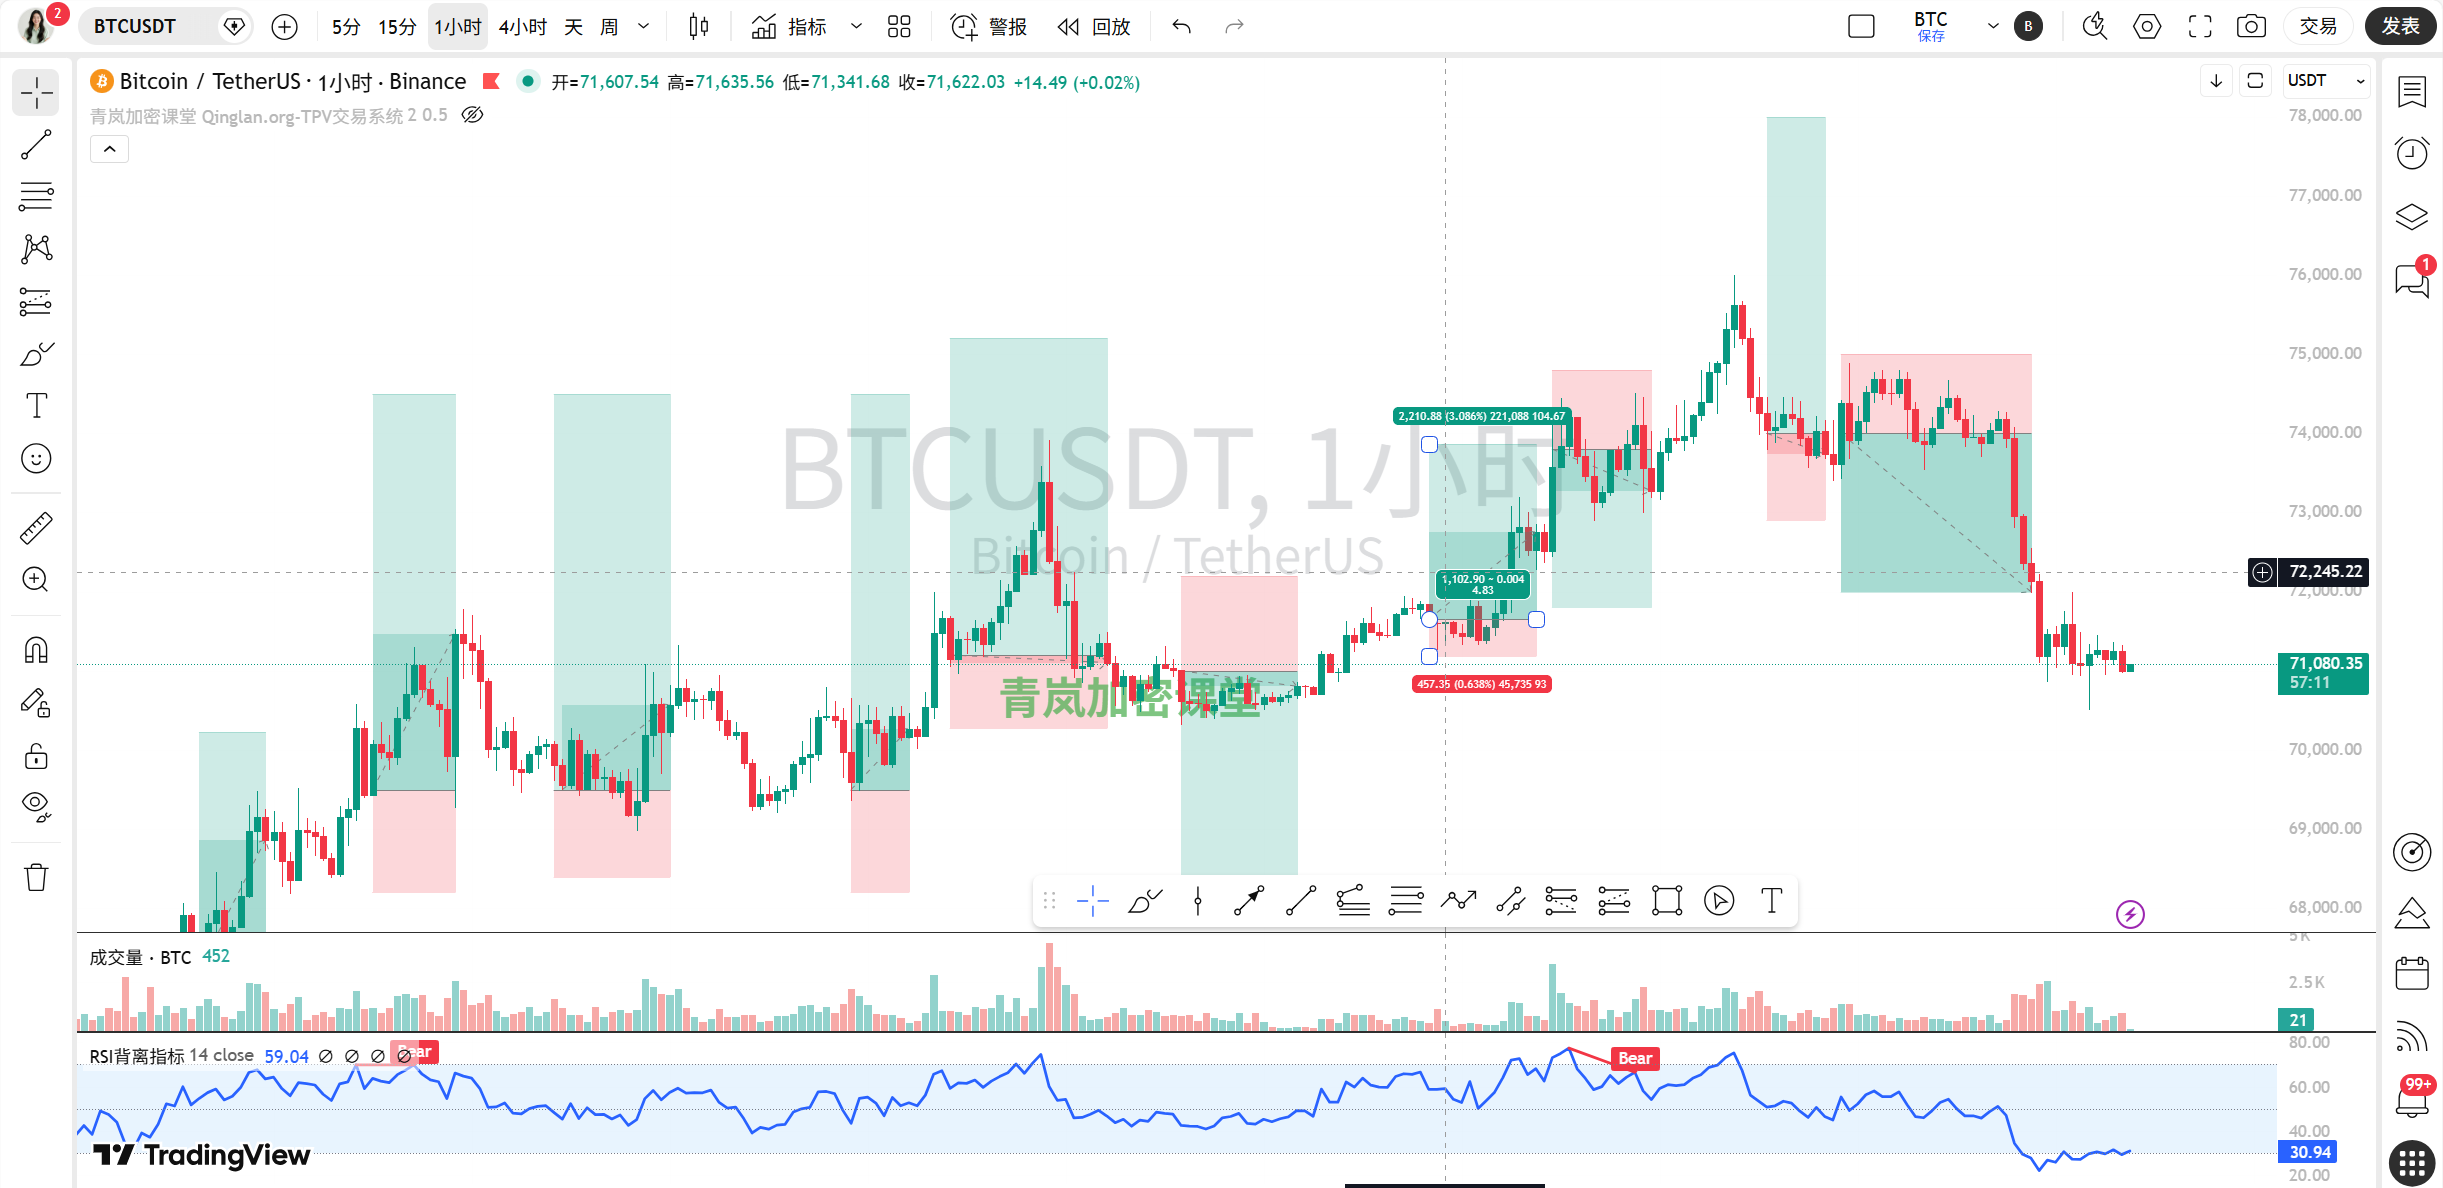
1-hour timeframe: The trend is "bearish arrangement", MA5 and MA10 are below MA30, a clear short-term downward trend. The resistance level is around 72500, and the support level is at 71000. The price has slid down from above 74000. The total on-chain market value dropped by 1.59% in 24 hours, indicating capital outflow, combined with the negative news of "hawkish pressure from the Federal Reserve" and "Powell's hawkish no interest rate hike", directly set a downward tone for the 1-hour level, and the market mood is very bleak.
15-minute timeframe: The trend is also "bearish arrangement", the smallest downward trend. The resistance level is at 71500, and the support level is around 70800. The price is declining in a small range. This level is most sensitive to news; you can see the headlines saying "whales closing short positions for profit" and "BARD contract crashes," the market mood swings accordingly, but the big background is fear, so even small rebounds are weak and easily crushed down.
Step Two: Key Level Identification and Reversal Patterns
Daily timeframe: Be cautious of the "double top" pattern! The left shoulder high is around 76000, and if the current rebound does not go beyond it, it may form the right shoulder. The formation of this pattern is largely catalyzed by hawkish messages from the Federal Reserve, with market expectations for tightened liquidity suppressing the price. The current price is around 71000, testing this potential double top neckline area (71000-71500), very critical!
4-hour timeframe: Looks like a large "descending flag" or "rectangle consolidation". The upper edge is at 75000, the lower edge is at 71500. The news interweaves both bullish and bearish messages, such as "SEC approves tokenization trading" which is a long-term positive, but in the short term is overshadowed by macro bearishness, causing price oscillation within this pattern. Now the price is hovering near the lower edge of the pattern, testing support.
1-hour timeframe: A "descending channel" has appeared. Each rebound high is decreasing. The formation of this channel is directly related to Powell's continuous hawkish statements that delayed the market's interest rate cut expectations, continuously releasing bearish power. The current price is near the lower boundary of the channel, and if it breaks, the decline will accelerate.
15-minute timeframe: A small "head and shoulders bottom" prototype is forming, with the left shoulder and head near 70900, and the right shoulder is developing. However, this small-level pattern is very fragile, and a negative news can break through. The current price is below the neckline of the pattern (around 71200), which has not yet broken through, very weak.
Step Three: Technical Indicator Verification
Daily MACD: DIF is positive, histogram is also positive, but there is no golden cross or dead cross, momentum is average. RSI is 50.4, neutral and slightly weak. This verifies that although the daily trend is bullish, the momentum is insufficient. The on-chain trading volume is not particularly large, indicating indecisive buying and selling at this position, providing moderate credibility to the indicator signals.
4-hour MACD: DIF is negative, DEA is positive, and the histogram has a large negative value (-483), indicating that bearish momentum is still being released. RSI is at 30.17, close to the oversold zone. This verifies the bearish oscillation pattern in the 4-hour timeframe. Combined with the on-chain fear index, market sentiment is poor, and this oversold condition may last for a while.
1-hour MACD: Both DIF and DEA are negative, and the histogram is also negative, a typical bearish trend. RSI is only 23.75, which is severely oversold! This verifies that the downward trend in the 1-hour level is both rapid and intense. However, severe overselling also means that a technical rebound may occur in the short term. On-chain capital is flowing out, indicating that this decline has real selling pressure.
15-minute MACD: Both DIF and DEA are negative, but the histogram has turned positive (12.53), indicating a very small bullish divergence prototype, suggesting that the downward momentum may be weakening. RSI is at 39.75, still biased to weakness. This verifies that the downward trend at the 15-minute level is slowing down, possibly brewing a small rebound. However, on-chain emotions are panicking, making such small-level divergences easy to be overwhelmed.
Step Four: Comprehensive Analysis of On-Chain Data and News
News:
Bearish factors (dominant): Federal Reserve hawkishness (Powell says no interest rate cuts), interest rate hike anticipation disturbances, soaring US treasury yields, inflation uncertainty, risk in Middle East situation. These are the mountains pressing down on the market, which have directly led to the recent decline.
Bullish factors (partial): Institutions like BlackRock have bought huge amounts of BTC, SEC approves securities tokenization (long-term positive), whales closing short positions (might mean some bears are taking profits). These messages provide partial support but seem insufficient in the face of macro bearishness.
Impact: Bearish news has directly catalyzed the price to fall from highs and suppressed any decent rebounds. Bullish news has created small fluctuations in the market and local support.On-chain data:
Fear and greed index is 26 (fear): Market sentiment is very poor, in a state of panic. Such emotions can lead to irrational selling but may also brew a rebound from extreme situations.
BTC dominance is 56.69%: still very high, indicating that capital is still in Bitcoin, altcoins are worse off, overall market risk appetite is low.
Total market cap is 2.61 trillion, down 1.59% in 24 hours: Overall capital is flowing out, placing pressure on the market.
Comprehensive analysis: The current market is in a synchronous state of "price decline" and "emotional panic", showing no divergence. This means that the downward trend may still have inertia. The hawkish tone of the news reinforces this on-chain pessimistic sentiment, indicating that the overall health of the market is poor and in a phase of adjustment.
Step Five: Market Forecast and Trading Thoughts
Current (within a few hours): Expected to weakly oscillate within the small range of 70800-71500, with a possibility of attempting an oversold rebound, but the strength is expected to be limited.
Key for today and in the near term: The most important support level today is the 71000-70800 area, which is the neckline of the potential daily double top and the recent low. If it breaks, the next target could be 70000 or even 69000. The most important resistance level is at 71800-72000, where the 1-hour moving averages exert pressure and the previous small platform. If the rebound can stabilize above 72000, the short-term downward pressure will ease.
Trading Ideas:
Trend-following opportunity (main idea): The current 1-hour and 4-hour trends are bearish. You can pay attention to price rebounds to the 71800-72000 resistance area. If there are signs of stagnation (like upper shadows, RSI turning), consider light short positions, with stop loss set above 72500.
Counter-trend opportunity (cautious): If the price quickly falls below 70800 and the 15-minute RSI shows serious bottom divergence (turning upwards after going below 30), aggressive traders can take a light position to bet on an oversold rebound, targeting around 71500, but must have a strict stop loss below 70500.
Wait-and-see: If the price oscillates directionlessly between 71000-71800 without clear breakout signals, it is best to wait and not enter the market easily. Wait for the market to digest these Federal Reserve messages before proceeding.
Summary: The core contradiction of the current market is the intense confrontation between the "macroeconomic hawkish liquidity tightening expectations" and the "long-term bullish narrative of cryptocurrencies", with bears currently dominant.
Trading Golden Sentence: Markets are born in despair, grow in hesitation, and end in frenzy. The market is currently caught between "despair" and "hesitation", so we must remain alert and be ready to spot opportunities!
Alright, that’s all for today’s analysis, see you next time!
More about the quantification of real-time information's impact on market sentiment has been updated in my Qinglan Crypto Class: www.qinglan.org
免责声明:本文章仅代表作者个人观点,不代表本平台的立场和观点。本文章仅供信息分享,不构成对任何人的任何投资建议。用户与作者之间的任何争议,与本平台无关。如网页中刊载的文章或图片涉及侵权,请提供相关的权利证明和身份证明发送邮件到support@aicoin.com,本平台相关工作人员将会进行核查。