The current price of Bitcoin is 69,700. This recent sharp drop of BTC is not the end of the world, but it is certainly not a good time to bottom fish! From a peak of 75,998 to a drop to 68,750, many people panicked, either holding on stubbornly or randomly buying the dip. Remember, prioritize preserving your capital in trading before discussing profits. Following the downward trend now is more reliable than betting on a rebound! The downward trend of BTC has formed a resonance on the daily, four-hour, and 30-minute levels; stubbornly holding long positions will only lead to deeper entrapment. For those without open positions, it is better to follow the trend south; do not think about catching a cheap bottom, preserving your capital is always more important than stubbornly waiting for a recovery!
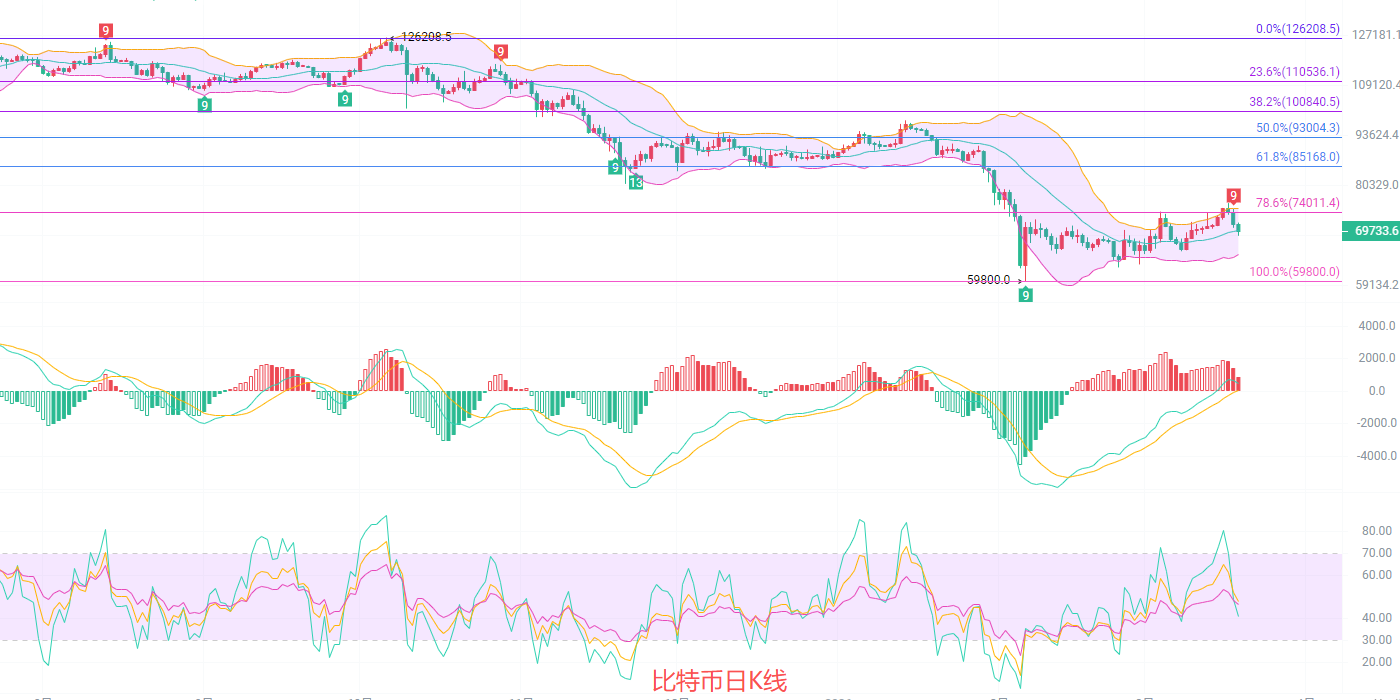
The daily chart shows a peak at a high point, confirming the downward trend. The K-line pattern forms a cloud cover combined with a consecutive bearish adjustment pattern, with the trend and position breaking below the key support of 74,000. It is currently operating below the middle line of the Bollinger Bands, and the Bollinger Bands are opening downwards, confirming a short-term peak signal. The MACD indicator quickly turns from red to green, with the DIF and DEA crossing downwards, and the RSI falling from a high to around 40, indicating that bullish momentum is completely exhausted, and the downward trend is taking full control of the market. The support point is at 69,000; if it is lost, it will further target 68,000 or even lower.
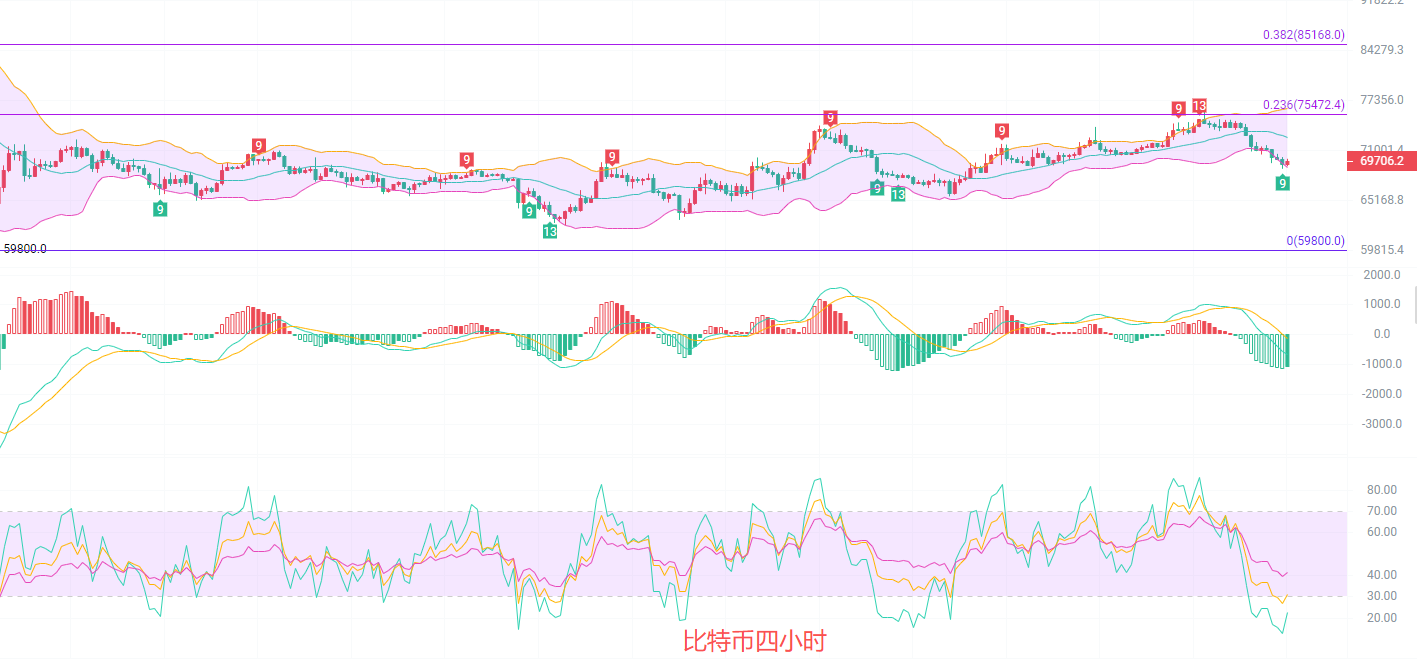
The four-hour chart breaks through the 70,000 mark, and the weak oscillation pattern is difficult to change, briefly stabilizing near 69,000. It is currently in a weak oscillation, with the EMA moving averages forming a bearish sequence, and the price is firmly pressed below the middle line. Any rebound is merely a trap for bulls and not a reversal signal. The MACD green bars continue to expand, and the RSI has dropped to around 25, indicating an oversold area. Although there is an expectation of a rebound from overselling, the strength is likely to be limited, and it is difficult to change the weak structure. Pay close attention to the upper pressure at 70,200-70,500 and the key support at 68,800-69,000; within this range, the probability of oscillation is high, and breaking through will lead to continued decline.
Short-term trading view reference: The market is never 100% certain, so always maintain stops; safety first, small losses with big profits is the goal.
For positions northbound from 68,800 to 69,000, set a stop loss at 68,500, targeting 69,800 to 70,000. This is a gamble on an oversold rebound, not a trend buy; it is recommended to control the position size with quick in and out trades! Never fall in love with battle.
For positions southbound from 70,200 to 70,500, set a stop loss at 71,000, targeting 69,500 to 69,000. If the price breaks below 69,000, continue to look down to 68,500 to 68,000.
In the cryptocurrency circle, those who are insightful reap the rewards, those who realize too late only get the broth, and those who are oblivious take over the positions.
Specific operations should rely on real-time market data. For more information and details, you can consult the author. There may be delays in article publication, and the suggestions are for reference only; risks are to be self-assumed.

Warm reminder: The above content is created solely by the author for the public account. The advertisements at the end of the article and in the comments section are unrelated to the author, so please discern carefully. Thank you for reading.
免责声明:本文章仅代表作者个人观点,不代表本平台的立场和观点。本文章仅供信息分享,不构成对任何人的任何投资建议。用户与作者之间的任何争议,与本平台无关。如网页中刊载的文章或图片涉及侵权,请提供相关的权利证明和身份证明发送邮件到support@aicoin.com,本平台相关工作人员将会进行核查。