Welcome to the Qinglan Crypto Classroom, I am Qinglan. Let's get straight to the point:
Today we will continue analyzing from four cycles, all practical insights:
Step One: Trend Determination
We will look from a larger to a smaller scale!
In the daily cycle, the closing price has dropped from nearly 90,000 to just over 70,000 now, but it has been fluctuating around 70,000 in the past few days. MA5 is at 72076, MA10 is at 71607, MA30 is at 68999, which indicates a bullish arrangement with short-term moving averages above long-term moving averages! This shows that the long-term trend framework has not completely broken down. However, combined with the news "Bitcoin breaks below $69,000" and the on-chain fear and greed index at only 11, indicating "extreme fear," market sentiment is very poor, creating a thick shadow over the daily upward trend. Resistance is seen at the previous high near 75,000, while support is first observed at the MA30 around 69,000.
In the 4-hour cycle, the closing price has dropped from 74884 to 70413, a significant decline. MA5 is at 69996, MA10 is at 70517, MA30 is at 72446, showing a typical bearish arrangement where short-term moving averages are below long-term moving averages, indicating a clear downward mid-term trend! The key resistance is around MA30 at 72446, with support looking to the previous low area of 69500. The news about "whales shorting with 20x leverage" and "quarterly options expiration" adds fuel to this downward trend, and market panic is well reflected in the 4-hour level.
In the 1-hour cycle, the closing price is at 70413, recently fluctuating around 70,000. MA5 and MA10 are both near 70200, and MA30 is at 70379, with the three lines almost sticking together, which is a typical interweaving of moving averages, indicating a short-term trend with no direction! The upper limit of the fluctuation zone is seen at 71200, with the lower limit at 69800. The on-chain data indicates a total market value drop of 1.11% over 24 hours, and trading volume may be shrinking, indicating that both bulls and bears are hesitant at this position, waiting for new news guidance.
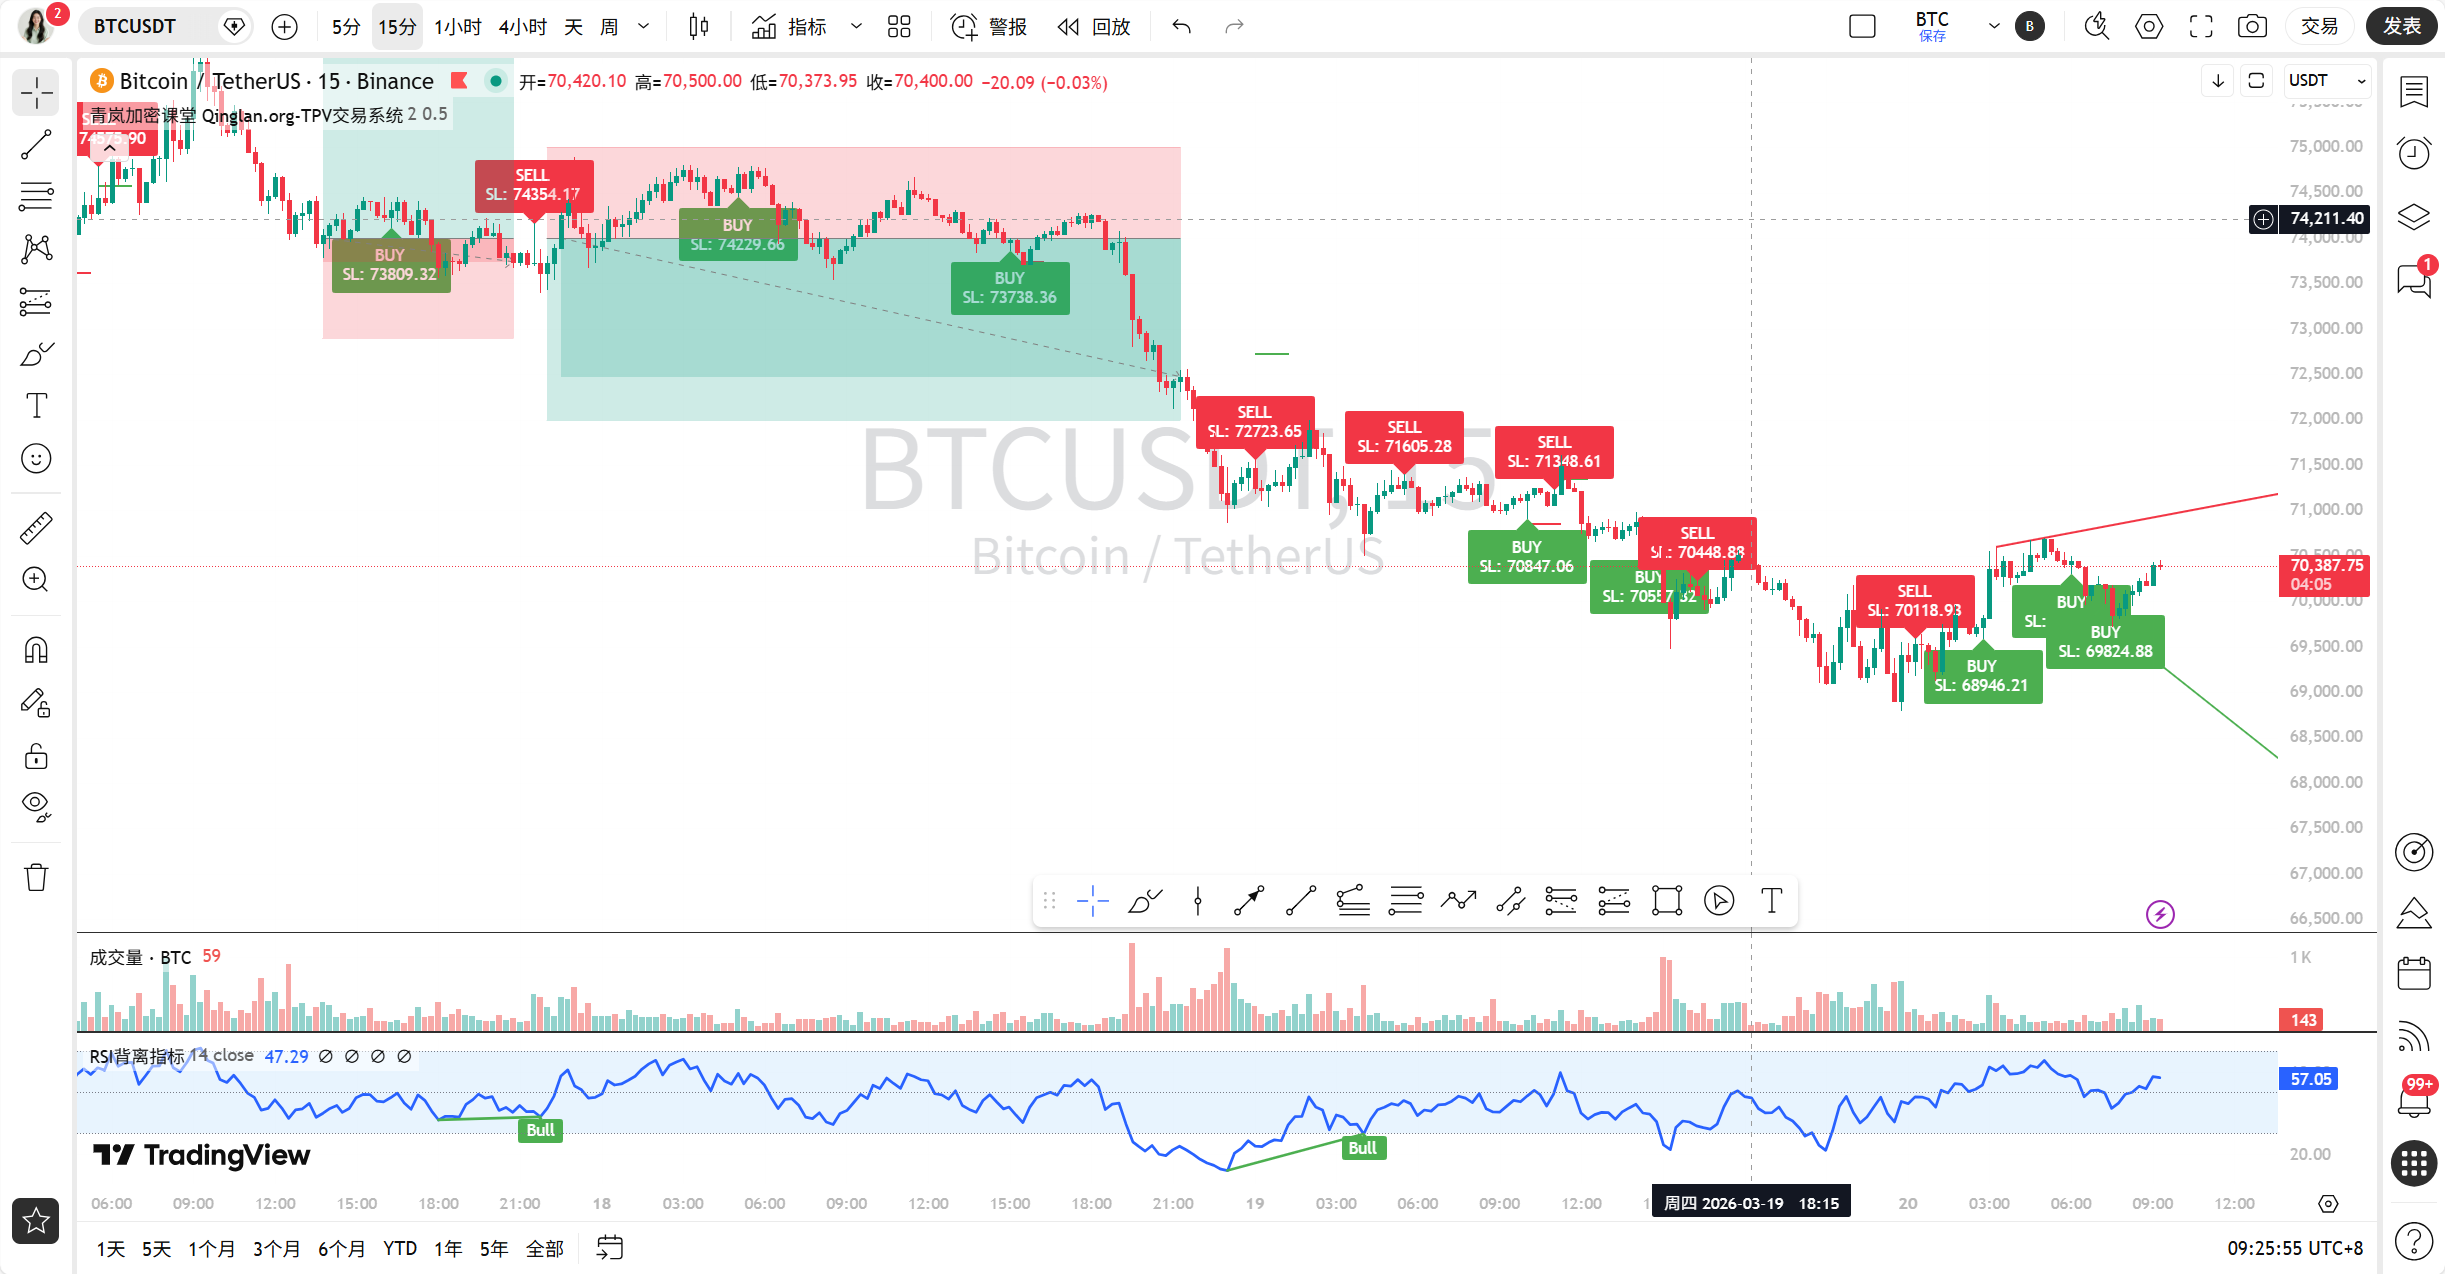
In the 15-minute cycle, the closing price is 70413, the most detailed rhythm. MA5, MA10, and MA30 are all interweaving around 70200, indicating a small fluctuation range. Its task is to follow the 1-hour cycle with narrow fluctuations, with resistance at 70800 and support at 70100. The rapid switching between "breaking down" and "stabilizing" in the news headlines corresponds to the jumping behavior at the 15-minute level.
Step Two: Key Level Identification and Reversal Patterns
At the daily level, we need to be cautious if we are forming a "double top" or "head and shoulders" right shoulder! The left shoulder peak is at 76000, the head is at 76000, and the current right shoulder is rebounding, with the neckline around the 69000-70000 area. If it breaks below this neckline, the pattern will be established, and the space for decline will open up. The news headline "When is the bottom buying opportunity for Bitcoin? Four classic indicators fail" indicates that the market is searching for the bottom but has not confirmed it, and this potential top pattern is being tested by panic sentiment.
At the 4-hour level, the recent wave of decline resembles a break after a "descending flag" formation, with the price hovering at a low level and no obvious reversal pattern yet formed. Attention is needed to see if a "double bottom" can form here at 69500-70000, with the right bottom currently being constructed. The news like "SEC Chairman: The new regulatory framework for crypto assets is just the beginning," which is long-term bearish, may delay the formation of the bottom pattern.
At 1-hour and 15-minute levels, the patterns are even smaller. The 1-hour around 70,000 can be viewed as a small "fluctuation box." The 15-minute cycle shows even smaller fluctuations within this box. The news "Bitcoin fluctuates and breaks below 71,000" exactly describes the behavior of prices meeting resistance and falling back at the upper edge of this box. The current price at 70400 is right at the lower-middle position of the 1-hour box, testing the support below.
Step Three: Technical Indicator Verification
In the daily MACD, the DIF is 442, the DEA is 182, and the histogram remains positive at 260, with no death cross, but the length of the bars is shortening, indicating weakening upward momentum! RSI is at 56.97, neutral to strong, not overbought or oversold. This verifies that although the daily trend has not reversed, the momentum is insufficient, showing signs of "divergence" — the price has fallen from a high position, but the indicators have not completely followed suit. The shrinking total market value on-chain indicates potential concerns about insufficient trading volume for this divergence.
The 4-hour MACD looks poor, with DIF at -663, DEA at -304, and a negative bar at -358, indicating strong bearish momentum, with no golden cross in sight. RSI is only 25.03, already in the oversold area! This suggests that the 4-hour decline may have been excessive, and there is a technical possibility of a rebound from oversold conditions. However, the extreme fear on the on-chain fear index may prolong this oversold state.
The 1-hour MACD shows DIF at -294, DEA at -449, and a positive bar at 154, which is interesting; although both lines are far below the zero axis, the green bar has appeared, suggesting that the downward momentum may be weakening, with preliminary signs of bullish divergence. RSI is at 55.84, returning to neutral, also supporting the judgment of fluctuation.
The 15-minute MACD is in a golden cross state, with both DIF and DEA above the zero axis, though the bars are very small at only 0.7, indicating weak momentum. RSI is exactly at 50.01, which is neutral. This completely aligns with its fluctuation characteristics, and the indicators do not provide a clear direction.
Step Four: Comprehensive Analysis of On-Chain and News Factors
News Factors: A heap of bad news! "Bitcoin breaks below 69,000," "speculation on Federal Reserve interest rate hikes," "whales shorting with high leverage," "exchange reserves declining," "options expiration pressure." As for good news, there is a bit, but it’s relatively weak: "institutions increasing BTC holdings" (Strive, DDC), "new DeFi protocols launched," "progress in crypto market structural negotiations." Clearly, the current market is dominated by negative news, especially as the price breaks below key psychological levels and macroeconomic worries, directly leading to this wave of correction from the daily to the 4-hour level.
On-Chain Data: Fear and greed index at 11, indicating extreme fear! This is an extremely extreme emotional indicator. BTC dominance is at 56.42%, still high, indicating that capital has not fled from Bitcoin to altcoins on a large scale. The total market value is 2.49 trillion, down 1.11% in 24 hours. Here, an interesting "divergence" appears: prices are fluctuating at relatively high levels (compared to last year), while market sentiment has reached the freezing point of extreme fear. This usually does not indicate a healthy upward continuation signal, but may suggest that if sentiment does not improve, prices will have the incentive to search for support downwards. The bad news in the market and the panic sentiment on-chain resonate with each other.
Step Five: Market Prediction and Trading Thoughts
Current (within a few hours): The ultra-short term is fluctuating, with no direction in the 15-minute and 1-hour cycles. It is highly probable that it will continue to grind within this small box between 70100 and 70800.
Key for Today and the Near Future: The most important position today is the potential neckline support area of the daily "head and shoulders," which is around 69000-70000. This is a lifeline for bulls and bears! If the 4-hour level can stabilize at 70000 and rebound, there is hope to test 71200 (1-hour resistance) and 72400 (4-hour moving average resistance). If it breaks below 69500 and stabilizes, the next target may be 68000 or even lower.
Trading Thoughts:
Trend Following Opportunity: The mid-term trend (4-hour) is bearish, so the trend-following thought is to short on rebounds. Wait for the price to rebound to around 71200 (1-hour resistance), and if there are signs of stagnation (like a long upper shadow), and 1-hour RSI approaches overbought, consider a small short position, with stop loss above 71800, targeting 70000.
Counter-Trend Opportunity: Because the 4-hour RSI is already oversold, counter-trend betting for a rebound requires extreme caution. Only consider areas of strong support between 69500-69800, and if a 15-minute bottom divergence or bullish engulfing candle appears, a very small position can be taken to bet on a rebound, targeting 70500-70800, with stop loss below 69300. Remember this is counter-trend, so quick in and out!
Wait and See: Right now, bulls and bears are contending for key levels, with mixed signals. For most students, the best strategy is to wait and see, taking action only after the price moves out of this key area.
Summary: The core contradiction in the current market is the huge rift between the undamaged long-term trend structure and the short-term extreme panic sentiment.
Trading Maxim: Be greedy when others are fearful? The premise is that you need to confirm if that is truly the “end of fear,” okay!
Alright, today’s analysis ends here, and we will see you next time!
More quantifiable breakdowns on the impact of real-time news on market sentiment have been updated in my Qinglan Crypto Classroom: www.qinglan.org
免责声明:本文章仅代表作者个人观点,不代表本平台的立场和观点。本文章仅供信息分享,不构成对任何人的任何投资建议。用户与作者之间的任何争议,与本平台无关。如网页中刊载的文章或图片涉及侵权,请提供相关的权利证明和身份证明发送邮件到support@aicoin.com,本平台相关工作人员将会进行核查。