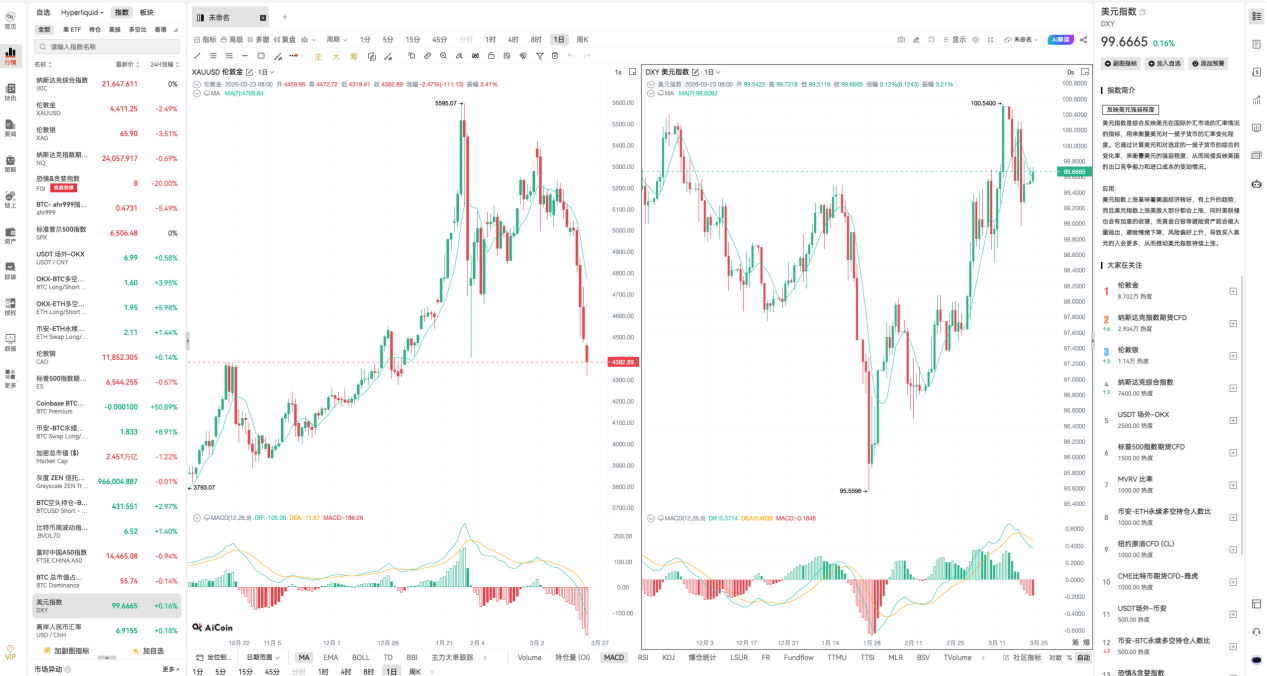
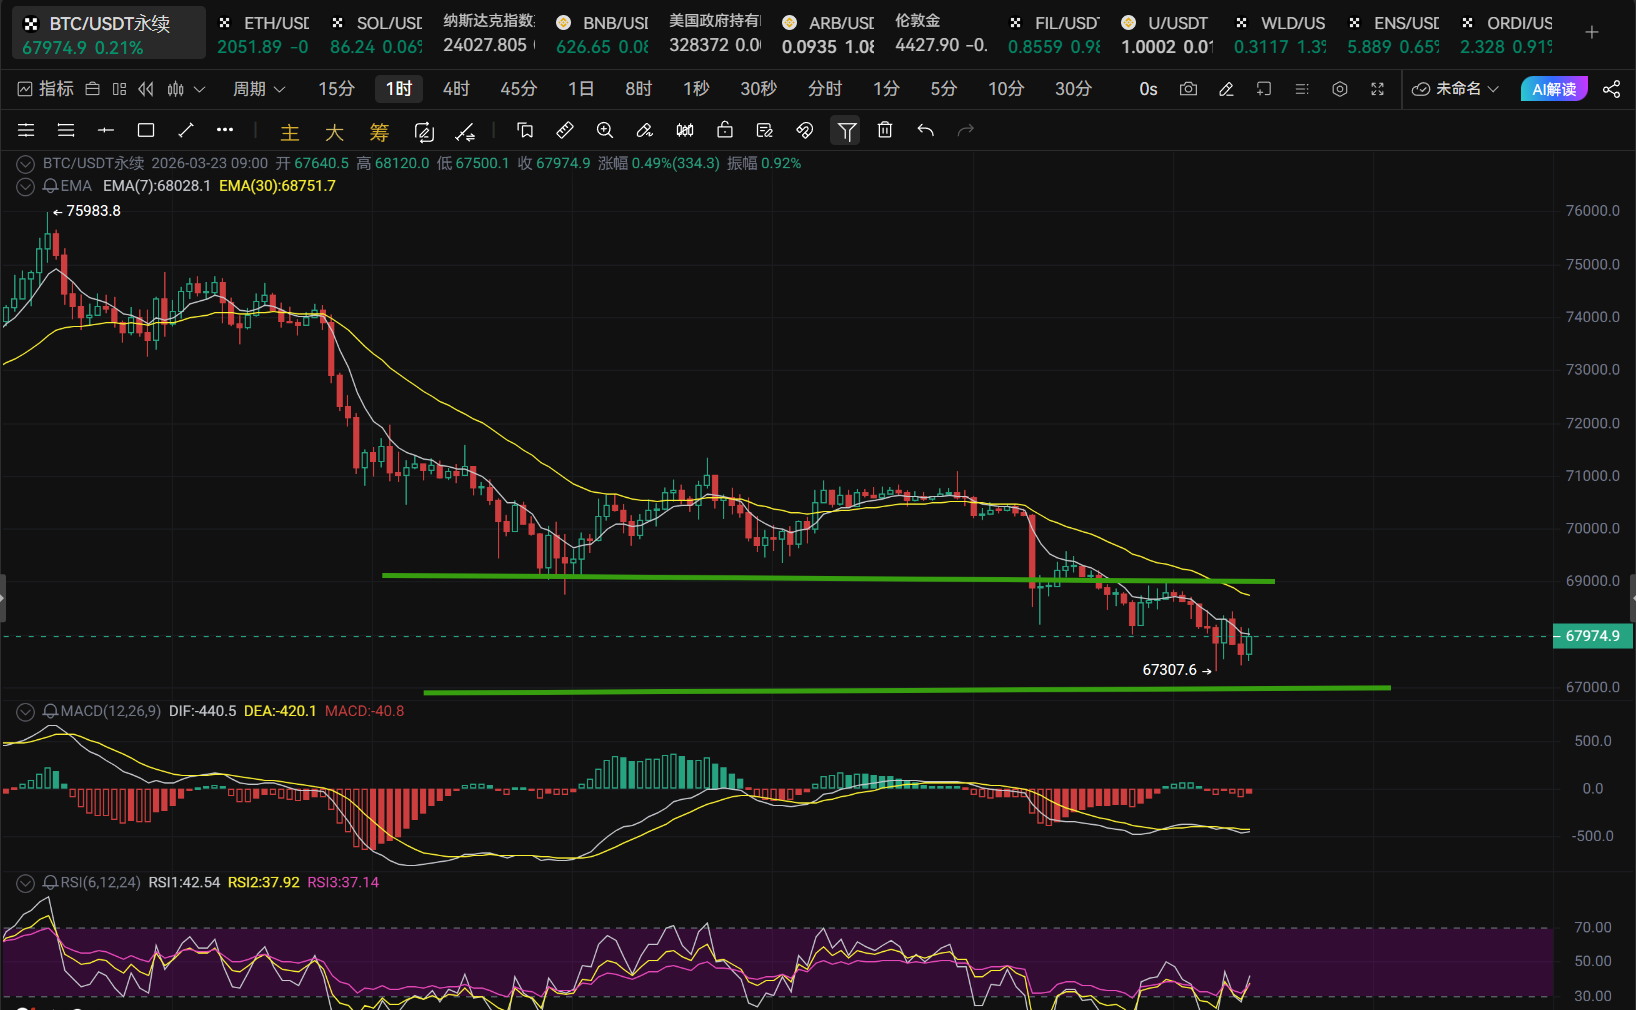
The price of the pancake has fluctuated like a roller coaster, from 75985 to the current 68000. Such large fluctuations in the market imply instability, with some making losses and others taking profits. I guess most people are still making loss trades, and the changes in technical indicators have been substantial. How to capture the entire market trend? Here is my understanding.
Trend Analysis
Candle Patterns:
A long down candle appears on the daily chart, indicating a bottoming structure (lowest of 67360 on March 22, closed at 67800). This shows that there is strong buying support in the 67500 area. The hourly chart has tested the 67500 price three times without effective support, forming a short-term triple bottom structure.
Technical Indicators:
The MACD daily double lines are below the zero axis and have shown a death cross but with shorter green bars, indicating no obvious rise.
RSI14 on the daily chart is at 43.5, in a neutral to bearish zone. The hourly RSI is at 34.8, moving out of the oversold area but has not broken through the 50 strength boundary.
The EMA on the weekly and monthly charts shows a bearish arrangement, with the price being constrained by the EMA on the weekly chart.
Volume:
After a volume increase and decline on March 22 (4774), there was a volume-reduced rebound. The current hourly trading volume is only 73, indicating insufficient momentum. Key price fluctuations are accompanied by increased trading volume, but the price changes are minimal.
Conclusion: Along with the price drop, a double bottom support is formed. The price remains stable below 67000, with fluctuations in the 69000-67000 range showing reduced volume. Once a breakout occurs between the two, there will be a scenario of overbought and oversold conditions. We can follow the market trend for either breakdown or breakout to make trades accordingly.
Strategy Recommendations:
Long positions price: 67500-67600
Stop-loss price: 66500-66600
Take-profit price: 69500-69600
Short positions price: 69500-69600
Stop-loss price: 70500-70600
Take-profit price: 67000-67500
(Strategy recommendations are for reference only; communication and trading: g18607105568)
免责声明:本文章仅代表作者个人观点,不代表本平台的立场和观点。本文章仅供信息分享,不构成对任何人的任何投资建议。用户与作者之间的任何争议,与本平台无关。如网页中刊载的文章或图片涉及侵权,请提供相关的权利证明和身份证明发送邮件到support@aicoin.com,本平台相关工作人员将会进行核查。