In last week's weekly report, we explicitly pointed out that the market is in a trap for inducing buying, advising investors not to blindly chase prices up and maintaining the judgment of the bearish trend. This week's market performance has clearly validated this — Bitcoin failed to effectively break through the resistance zone, followed by a noticeable retreat, and the bearish logic continues to hold.
The following text will present the market forecast for this week, operational strategy suggestions, and a review of last week's trading execution, assisting readers in grasping direction and making precise decisions in a complex market.
Core Summary of the Weekly Trading Report:
• HYPE Short-term Trading Effectiveness: Last week completed a short-term long position operation (1x leverage), successfully achieving a return of approximately 4.41%. (Details in the second section)
• BTC Short-term Trading Effectiveness: Last week completed a short-term short position operation (1x leverage), successfully achieving a return of approximately 5.37%. (Details in the fourth section)
• HYPE Forecast and Operational Strategy for this Week: See sections one and two for details.
• BTC Market Dynamics Forecast and Medium-Short Term Operational Strategy: See sections three and four for details.
• Core View Verification: Last week Bitcoin remained in a bearish trend pattern, which fully matches our forecast, and the warning of inducing buying has effectively materialized.
1. HYPE Forecast and Operational Strategy
1. Core View for this Week:
Based on the current structure, we judge that the downward adjustment at the hourly level that started from the peak on March 19 (around point 27) is likely to end soon. The subsequent trend needs to observe whether the price can effectively break free from the constraints of the central zone C to confirm whether the adjustment has truly ended. If a breakout occurs, the signal for the continuation of the trend will become clearer. It is expected that there is a high probability of a wide fluctuation range in the market this week, and operational flexibility should be maintained.
2. HYPE Upside Risk Warning:
It should be particularly noted that although HYPE's movements are independent, they cannot completely detach from Bitcoin's broader environment. If Bitcoin's movement shows a significant adjustment later, it may drag down HYPE's rebound momentum, and investors should remain vigilant and prepare for risk.
3. Operational Strategy for this Week:
Utilize 30% of the position, set stop-loss points, and based on support and resistance levels, look for "price difference" opportunities. (Using 30-minute/60-minute as the operation cycle). It is advisable to maintain a light position and act flexibly while strictly adhering to stop-loss discipline.
2. Analysis of HYPE's Market Structure and Short-term Operation Review from Last Week
1. Continuous Tracking of HYPE Market Dynamics and Investment Opportunities
Since late February, we have been continuously tracking and evaluating HYPE, with each judgment effectively validated by market movements, as reviewed below:
• February 23 Weekly Review: First pointed out that HYPE may enter an investment window, indicating that at that time the market was in the II wave adjustment phase, predicting a potential start of the III wave main rally.
• March 3 Weekly Review: Determined that the low point of February 24 at $25.60 could be the starting point of the III wave, confirming the potential location for trend reversal.
• March 9 Weekly Review: Pointed out that prices had effectively broken through multiple moving average resistances at the daily level, entering a phase of correction and consolidation, expecting a rapid rise thereafter.
• March 16 Weekly Review: Indicated that at that time the market was in a III wave trend, constructing an upward central zone (i.e., central zone B). It was predicted that once the construction was completed, the high probability of a wide fluctuation range would ensue.
2. Overview of the HYPE Daily Level Trend Structure: (Based on market evolution after January 21)
The current HYPE daily trend clearly shows a three-wave advancement pattern, with the characteristics of each sub-wave as follows:
• Wave I (Driving Wave): From the low point of January 21 at $20.46 to the high point of February 3 at $38.41, lasting 14 days, during which the maximum increase reached 87.73%, showing strong driving force.
• Wave II (Adjustment Wave): From the high point of February 3 at $38.41 to the low point of February 24 at $25.60, lasting 20 days, with the maximum decline during the period being 33.35%, falling within a normal retracement range.
• Wave III (Main Up Wave): From the low point of February 24 at $25.60 to present, the market has run for 27 days, with the maximum increase reaching 71.02%, the primary rising trend is still continuing and the structure is well-integrated.
3. HYPE Hourly Level Detailed Structure: (Based on market trends post March 16)
HYPE_60 Minute K-Line Chart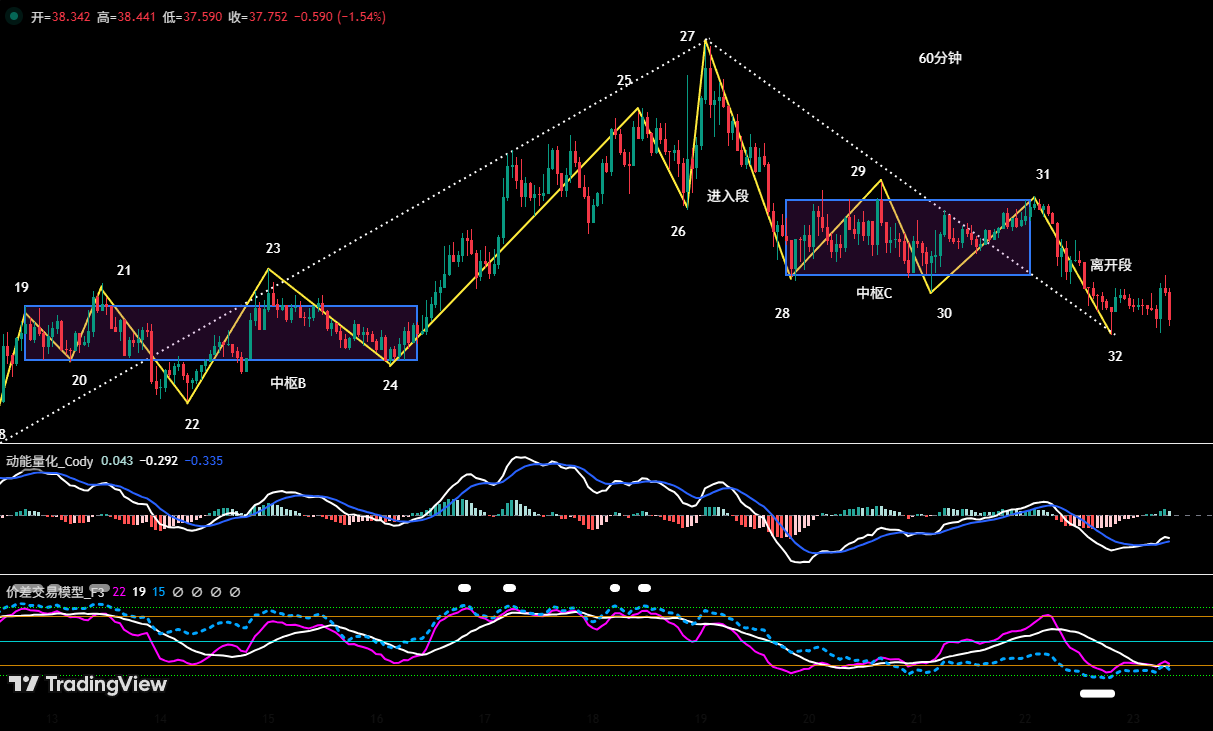
Figure 1
• HYPE Hourly Level Trend Structure Review: As shown in the chart, prices constructed a rising central zone (i.e., central zone B) during the latter half of March 9 to 15, and this has nearly completed construction, with the overall rhythm conforming to our previous forecasts.
• HYPE Hourly Level Internal Structure Division: (03.16~03.22)
a. As shown in (Figure 1), since point 24, the previously constructed rising central zone (i.e., central zone B) has been confirmed as complete. Subsequently, the market evolved into a complex structure composed of a total of 8 segments from 24-25, 25-26, 26-27, 27-28, 28-29, 29-30, 30-31, 31-32. As of the time of the analysis, the segment 31-32 is currently operational, with a relatively clear structure layer.
b. The segments 24-25, 25-26, 26-27 form a rising structure, showing a clear directional trend.
c. The segments 27-28, 28-29, 29-30, 30-31, and 31-32 form an adjustment structure, presenting obvious oscillating convergence characteristics.
d. Among them, the segments 28-29, 29-30, and 30-31 overlap with each other, collectively constituting a downward central zone (i.e., central zone C), which is the core interval of this adjustment.
4. HYPE Short-term Operation Review (1x leverage): (03.16~03.22)
Last week we executed a short-term (long position) operation based on trading signals generated from our self-constructed price difference trading model and momentum quantitative model, along with our expectations for the rising structure, successfully realizing a profit of 4.41%, with the execution process strictly adhering to the plan.
• HYPE Short-term Trading Details Summary: (Leverage x1)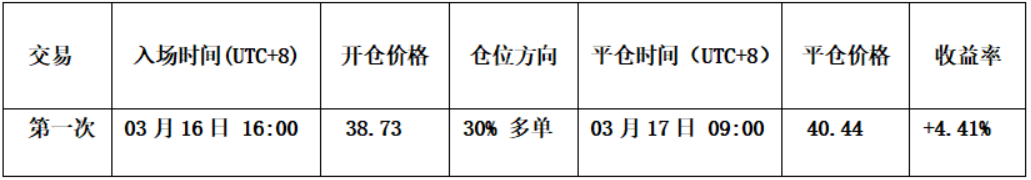
• Opening Decision: This opening decision was based on the expectation of the continuation of the trend after the completion of the rising central zone B structure. The specific triggering signal was the price effectively breaking through the upper resistance of the central zone (around $38.54), and both the price difference and momentum quantitative models issued a bullish resonance signal, significantly increasing the reliability of the entry timing with multiple bases. Accordingly, we executed the long position opening at $38.73 with a 30% position.
• Closing Decision: Based on the price difference quantitative model issuing a bearish signal for the top, combined with the technical resonance of the K-line "strong top formation" signal, the top characteristics are clear, thus we executed the liquidation operation around $40.44, locking in this profit.
• Trading Summary: This operation successfully earned about 4.41%, with the entry and exit points both receiving effective support from the model signals, showing high execution quality. 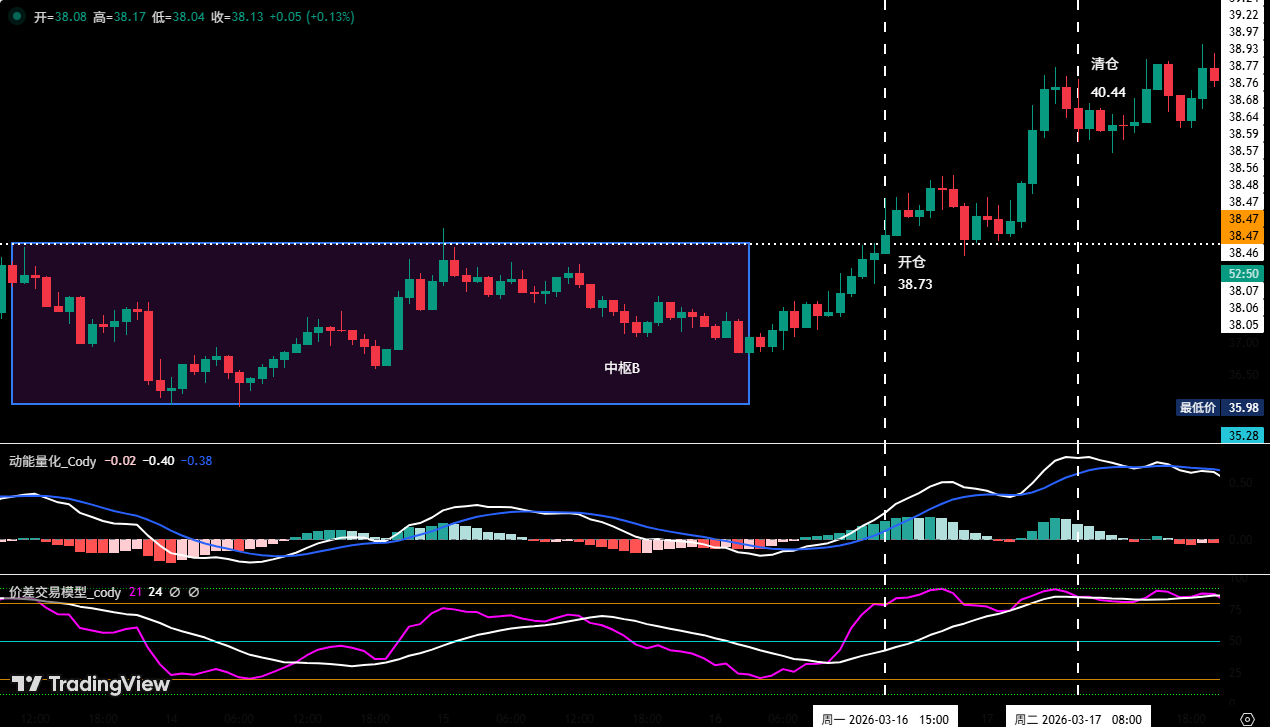
Figure 2
3. BTC Forecast and Operational Strategy for this Week (03.23~03.29)
1. Bitcoin Forecast Trend Structure Analysis (Based on the Market Post February 6 Low)
Using Bitcoin’s 4-hour timeframe for analysis:
• Maintain the previous core judgment framework: The upward trend initiated by Bitcoin from the February 6 low (around $60,000) is essentially a super drop rebound of the C-2 wave within the large C wave adjustment, and the nature of this rebound dictates its upper space's limitation, followed by a C-3 wave adjustment.
• Current Trend Structure Interpretation: In the 4-hour analysis timeframe, the short-term ascending structure formed from the low of February 24 has been damaged, and the defending capability of the bulls at critical positions has significantly weakened. If the current support cannot be regained subsequently, it may further test the lower boundary of the ascending channel formed since the rebound from the February 6 low. Once this level fails to hold, the probability of the C-2 wave rebound ending near the recent high of $76,000 will significantly increase, and the market may retest the $60,000 level downward, at which point market pressure will clearly intensify. Overall, the market remains dominated by a bearish trend pattern.
• Conditions for the Establishment of C-3: If the Bitcoin price falls below the February 6 low (around $60,000), then the C-3 adjustment wave will be established, and at that time the downward targets will reopen, and operational preparations must be made in advance. 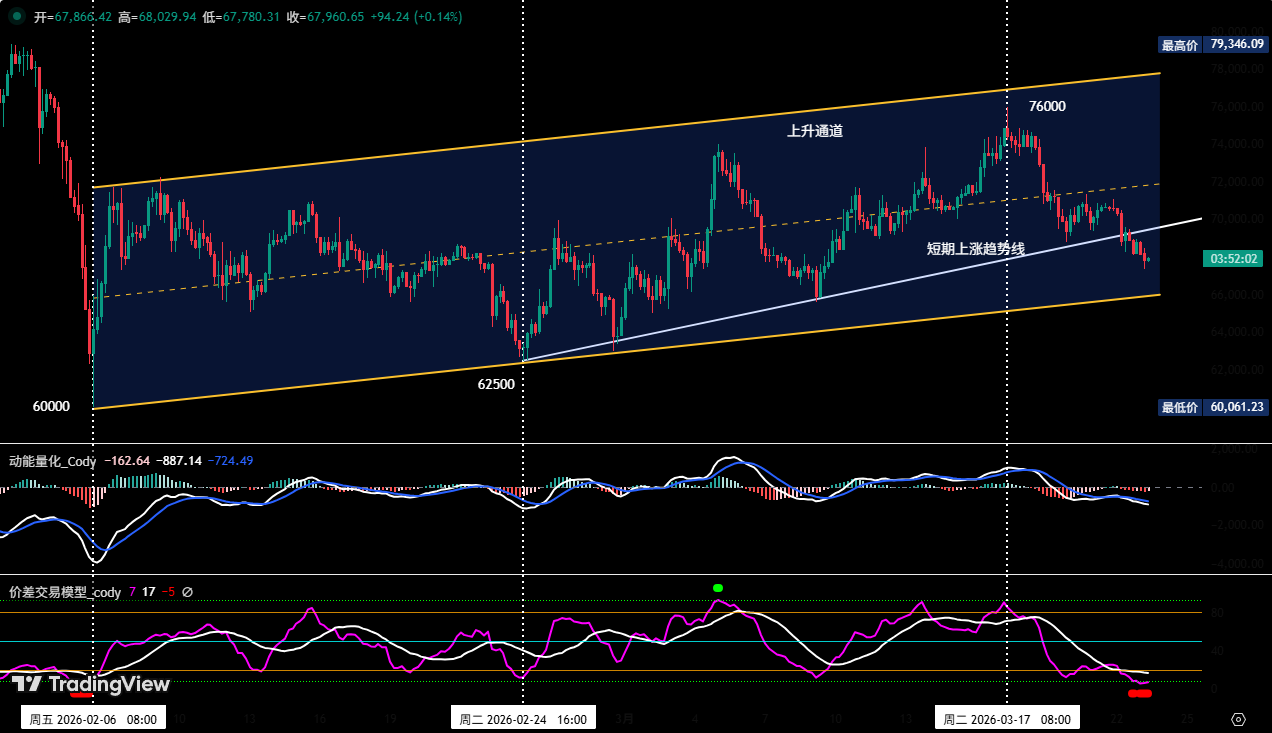
Figure 3
2. Forecast View for this Week:
Maintain an oscillating adjustment pattern, focusing on the contest at the lower boundary of the channel (since the February 6 low), where changes in trading volume and price responses will be critical bases for judging the subsequent direction.
3. Core Resistance Levels:
• First Resistance Zone: $69,500~$71,500 region (previous oscillation range, main resistance zone for short-term rebounds)
• Second Resistance Zone: $74,500~$76,000 region (near the low point of November 2025, an important reference for medium-term bearish strategies)
4. Core Support Levels:
• First Support Level: $65,000~$66,000 region (previous important support area)
• Second Support Level: $60,000~$62,500 region (near the February 6 low; if lost, the bearish structure will further strengthen)
• Third Support Level: Around $57,400 (an important technical reference point below)
5. Operational Strategies for this Week (excluding the impact of unexpected news):
① Medium-term Strategy:
Bitcoin Daily K-Line Chart: (Position Monitoring Model)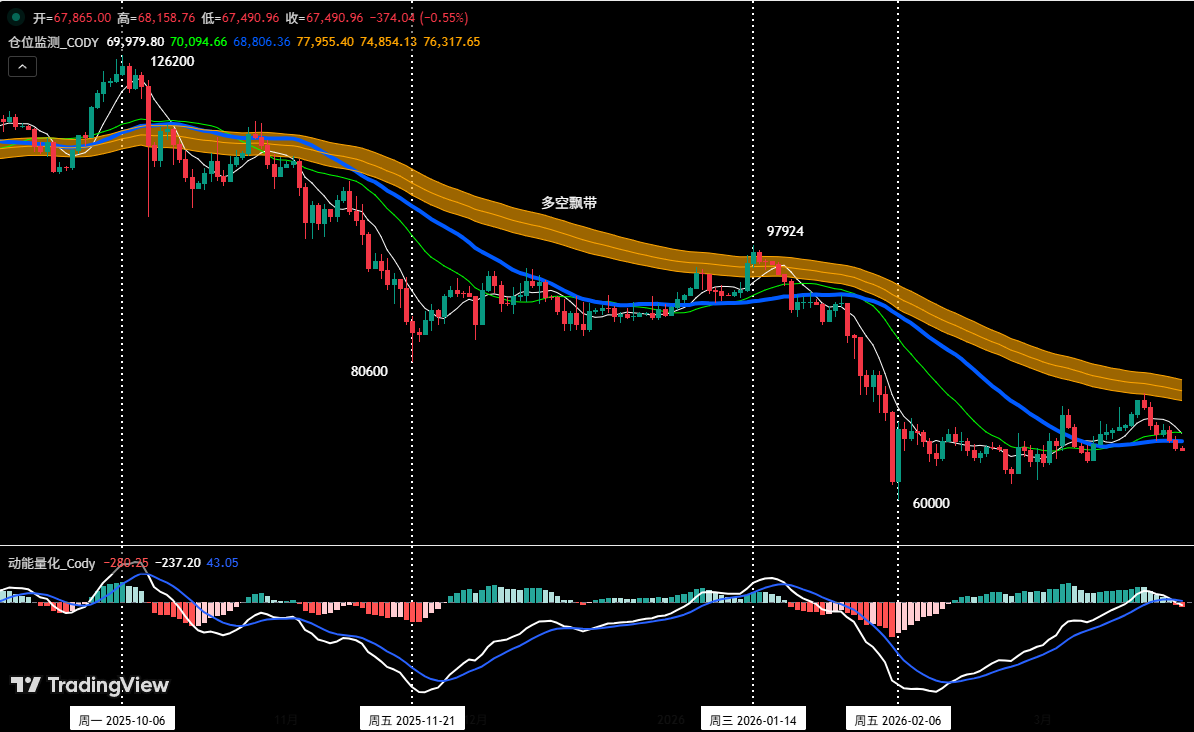
Figure 4
The position monitoring model indicates: Currently, the currency price is below the bullish and bearish floating band (yellow), and the bearish structure continues to hold. According to the strategy rules, we continue to hold the 60% short position established at $89,000 (on January 28), maintaining the medium-term direction unchanged.
• If the currency price effectively breaks through $74,500 during a rebound, we will reduce the medium-term position to 40%, mitigating risk exposure.
• If the currency price effectively breaks through the bullish and bearish floating band and stabilizes above, we will close all medium-term positions, adjusting the strategy accordingly.
② Short-term Strategy:
Utilize 30% of the position, set stop-loss points, and based on support and resistance levels, look for "price difference" opportunities. (Using 30-minute/60-minute as the operational cycle). Short-term operations must strictly enforce stop-loss discipline to avoid small losses becoming big ones.
③ Short-term Plans A/B:
As the mid-term direction of the market is bearish, the principle of "shorting with the trend" should be adhered to. To dynamically respond to the complex evolution of the market and in conjunction with signals generated from our trading model, we propose two sets of short-term operational plans, A and B, for practical reference:
• Plan A: Rebound Meets Resistance, Short on Rallies.
For scenarios where the rebound strength is limited and clear resistance levels are encountered, the specific execution is as follows:
• Opening: When the currency price rebounds to the $69,500~$71,500 region triggering a resistance signal, combined with the model’s top signal, a 15% short position can be established.
• Adding Positions: If the currency price continues to rebound to the $74,500~$76,000 region and meets resistance, an additional 15% short position can be taken, spacing out the layout to control the average cost.
• Risk Control: The initial stop-loss for both short positions is set above $77,000, strictly enforced without flexibility.
• Closing: When the currency price falls near important support levels, combined with model signals, positions can be gradually liquidated to secure profits, avoiding the risk of a complete liquidation in one go.
• Plan B: Trend-based Breakout Short Positions.
For scenarios where the currency price continues to decline and structural breakout occurs, specific execution will be as follows:
• Opening: When the currency price continues to adjust and breaks below the channel's lower boundary, if there is a pullback to this point but fails to stabilize, combined with the model’s top signal, a 30% short position can be opened in tandem with the trend to leverage inertia for increased returns.
• Risk Control: The initial stop-loss for the short position is set around 2% above the opening price (i.e., opening price ×1.02), strictly managing maximum losses.
• Closing: When the price falls to the support level and coincides with the model signals, positions can be gradually closed to secure profits.
4. Bitcoin Short-term Operation Review (03.16~03.23)
1. Short-term Operation Review:
We strictly followed the trading signals generated from our own price difference trading model and momentum quantitative model, combined with our forecast of the market trend, to complete a short-term (short position) operation last week, earning a profit of 5.37%, maintaining complete execution discipline.
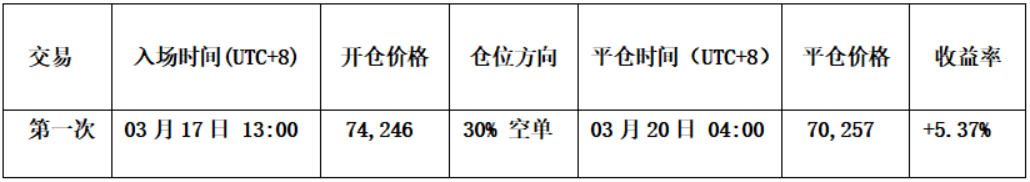
① Bitcoin Short-term Trading Details Summary: (Leverage x1)
 ② Short-term Trading Review:
• Opening: When the currency price rebounded to around $76,000 and faced resistance, the price difference trading model simultaneously triggered a strong top warning signal (green dot in the figure), resonating with the momentum quantitative model. Both models' signals were highly consistent, with clear top pressure characteristics. Based on this signal overlap, we established a 30% short position at $74,246 with sufficient entry basis.
• Closing: When the currency price fell to around $69,000 and showed stability, while the price difference trading model triggered a bottom warning signal, initial support characteristics were evident, thus we closed all positions around $70,257, timely securing profits.
• Summary: This trade successfully made a profit of about 5.37%, with accurate direction judgment on the short position, and both the entry and exit points supported by model signals, exhibiting good overall execution quality.
2. Medium-term Operation Review:
The medium-term strategy remains steadily advancing. We continue to hold the 60% short position established near $89,000 (on January 28), with a profit of about 23.75% as of last week after-hours (closing price around $67,865), and maximum profits reached 32.58%, with the medium-term position functioning well overall.
5. Special Reminder
Risk management is the foundation of stable trading profits. Please strictly adhere to the following execution discipline:
1. When opening a position: Immediately set the initial stop-loss level.
2. When profits reach 1%: Move the stop-loss to the opening cost price (breakeven point) to ensure capital safety.
3. When profits reach 2%: Move the stop-loss to the position of 1% profit.
4. Continuous Tracking: Subsequently, for every additional 1% profit, move the stop-loss position up by 1% to dynamically protect and lock in gains.
The financial market is ever-changing, and all market analyses and trading strategies must be dynamically adjusted. All views, analysis models, and operational strategies involved in this article stem from personal technical analysis and are intended solely for personal trading logs; they do not constitute any investment advice or operational basis. The market carries risks, and investment must be cautious; please do not make decisions based on this.
免责声明:本文章仅代表作者个人观点,不代表本平台的立场和观点。本文章仅供信息分享,不构成对任何人的任何投资建议。用户与作者之间的任何争议,与本平台无关。如网页中刊载的文章或图片涉及侵权,请提供相关的权利证明和身份证明发送邮件到support@aicoin.com,本平台相关工作人员将会进行核查。