At 10:09 a.m. on March 23, XRP is trading at $1.44783, showing signs of recovery after a recent pullback within the broader intraday range. Price has rebounded from levels near $1.36 and is now approaching the upper portion of the current range, reflecting renewed buying interest following earlier weakness. Over the past 24 hours, XRP has posted a gain of approximately 3.56%, with the latest upward move suggesting a shift in short-term sentiment as buyers regain near-term control.
From a 4-hour chart perspective, XRP’s price structure reflects a transition from a prior upward impulse into a corrective phase, followed by a developing rebound. The earlier advance peaked near $1.48 before encountering resistance, leading to a gradual decline toward the $1.36 region, where support emerged. Recent candles show a sharp upward move off that support zone, with price reclaiming short-term moving averages. Volume expanded during the selloff and again during the latest rebound, indicating active participation on both sides, while the current move higher is accompanied by increasing momentum as XRP presses back toward the mid-to-upper Bollinger Band range.
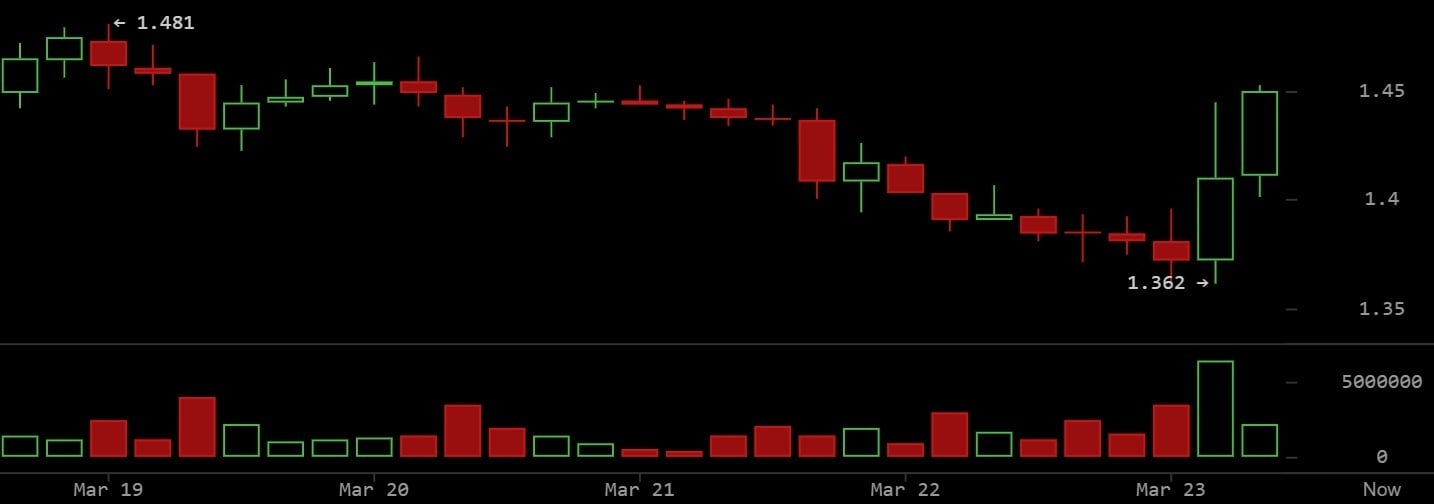
XRP 4-hour chart on March 23 via Bitstamp
Market sentiment shifted sharply on March 23 following signs of de-escalation after heightened geopolitical tensions. President Donald Trump said the U.S. and Iran had very good and productive conversations toward resolving hostilities, adding that he ordered a five-day postponement of planned strikes to allow discussions to continue. The improvement in tone followed an earlier warning issued two days earlier, when Trump demanded that Iran fully open the Strait of Hormuz without threat, stating that failure to comply within 48 hours would result in the U.S. moving to hit and obliterate Iranian power plants, starting with the largest facility. The shift helped lift XRP from its lows as immediate geopolitical risk eased and traders responded to the emerging diplomatic window.
Technical indicators provide additional confirmation of the improving short-term outlook. The Relative Strength Index ( RSI) has climbed to 57.41, moving above the midpoint and signaling strengthening momentum without yet reaching overbought conditions. The Moving Average Convergence Divergence ( MACD) has turned constructive, with a positive histogram reading near 0.00239, while the MACD line at approximately -0.01377 has crossed above the signal line near -0.01616, indicating a bullish shift in momentum. From a moving average (MA) perspective, XRP is trading above both the 14-period simple MA near $1.40784 and the 21-period simple MA around $1.42005, establishing these levels as near-term support. Bollinger Bands show price rebounding from the lower band near $1.36628 and moving toward the midline around $1.41832, with the upper band positioned near $1.47036, suggesting expanding upside potential as volatility remains elevated.
If XRP sustains its position above the $1.42–$1.43 area and continues to build momentum, a retest of the upper Bollinger Band near $1.47 becomes increasingly likely. A failure to hold above the reclaimed moving averages, however, would expose the asset to renewed downside pressure, potentially driving price back toward the lower band.
- What is driving XRP’s latest price rebound?
Improving sentiment and easing geopolitical tensions are supporting renewed buying interest. - Why are traders watching the $1.42–$1.43 range?
This zone acts as near-term support that could determine continued upside momentum. - What do technical indicators suggest about XRP?
Indicators show strengthening momentum with bullish signals emerging across key metrics. - What is the next key resistance level for XRP?
The upper Bollinger Band near $1.47 is the next major level traders are watching.
免责声明:本文章仅代表作者个人观点,不代表本平台的立场和观点。本文章仅供信息分享,不构成对任何人的任何投资建议。用户与作者之间的任何争议,与本平台无关。如网页中刊载的文章或图片涉及侵权,请提供相关的权利证明和身份证明发送邮件到support@aicoin.com,本平台相关工作人员将会进行核查。


