Everyone, we meet again! I am Sister Qinglan. Today, let's crush the data at hand and see what story the market is telling. Remember, price action is the market's most honest language, and our task is to learn to listen.
Market structure identification: Let's take it layer by layer.
First, look at the larger timeframe, the daily chart. The latest two candlestick close prices are 70556.74 and 70720.4, while a previous clear low is at 67859.0 (57th candlestick), and a high is at 71817.09 (58th candlestick). The price has rebounded from the low but has not yet broken the previous high, overall in a wide oscillation range, the structure leans towards oscillation.
The 4-hour chart is clearer. The latest close price is 70720.4, with a previous high at 71291.7 (60th candlestick) and a low at 69377.33 (58th candlestick). After testing the high, the price retraced and is currently in the upper middle of the range; the structure also leans towards oscillation but slightly upwards.
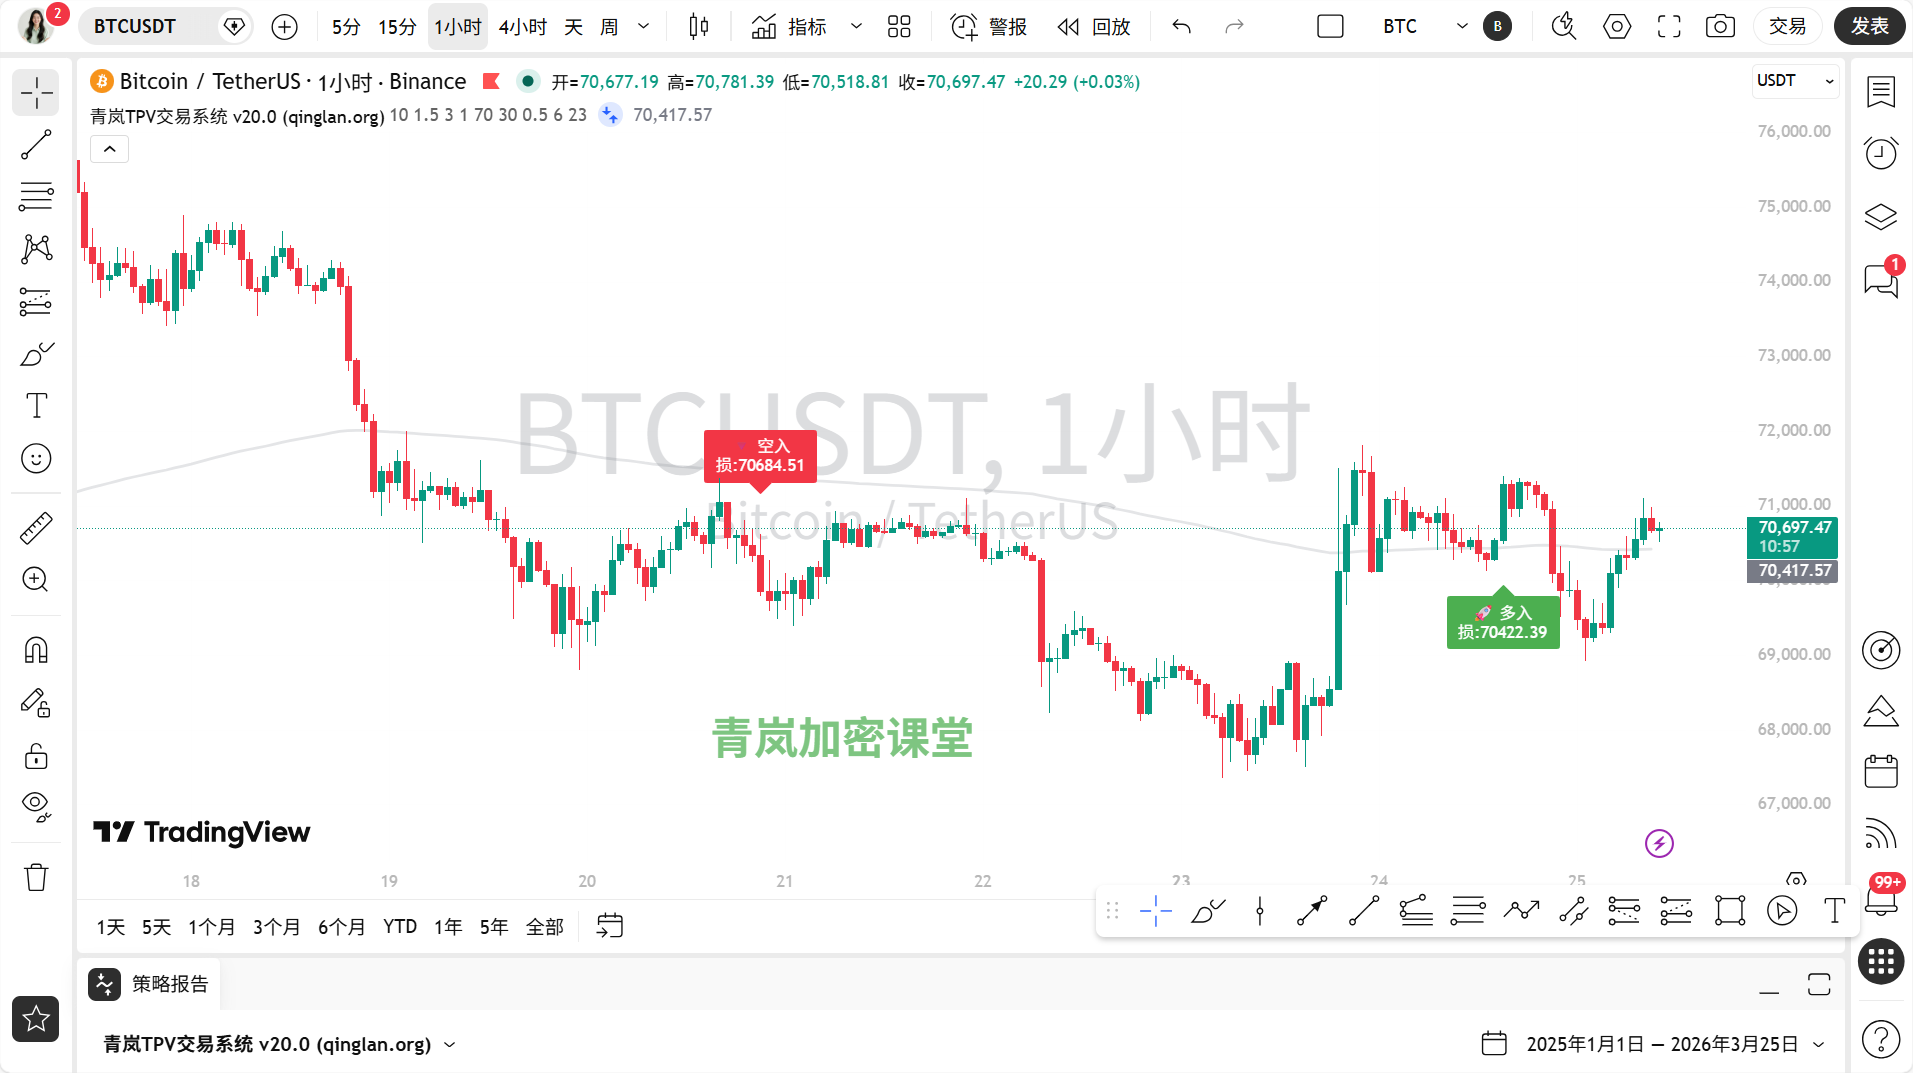
On the 1-hour chart, we look at the latest 30 candlesticks. The high occurred at 71291.7 (82nd candlestick), and the low appeared at 69869.93 (90th candlestick). After rebounding above 71000 from the low, the price retraced again, forming a lower high (compared to 71291.7) and a higher low (compared to 69869.93), which is a typical contracting triangle oscillation structure.
The 15-minute chart shows more fragmented fluctuations, with a high at 71291.7 (93rd candlestick) and a low at 70518.81 (latest candlestick). In the small timeframe, the price also oscillates within a small range.
To summarize: All timeframes currently point towards oscillation, with no clear unilateral trend structure. The larger timeframe sets the direction, oscillation; the smaller timeframe seeks position, also oscillation. This sets the tone for our next operations.Key levels and price rejection signals:
We focus on the last 24 hours (corresponding to the 1-hour and 15-minute charts). An obvious resistance area is around 71000-71200. 👉 On the 1-hour chart, prices fell back after encountering significant resistance at 71291.7 (82nd candlestick) and 71157.77 (86th candlestick). The support area is around 70500; the latest candlestick on the 15-minute chart has a minimum price dipping to 70518.81, and previously it had stabilized multiple times above 70500.
Regarding price rejection patterns, the data does not provide a perfect Pin Bar or bearish engulfing typical structure. For instance, on the 1-hour chart at the 71291.7 candlestick, the highest price was 71400.0, the lowest was 70850.11, and it closed at 70964.15, showing an upper shadow but not a particularly exaggerated Pin Bar. Therefore, no textbook-level typical price rejection patterns were found; instead, there are more regional resistance and support effects.Volatility nature judgment:
We look at the latest 10 15-minute candlesticks (counting back from the close price of 70720.4). Their bodies are generally small, for example, from 70677.18 to 70720.4, with a body of only about 43 points. The shadow lengths are also limited; the latest candlestick has a high of 71068.93 and a low of 70518.81, with both upper and lower shadows, but the overall volatility range (about 550 points) has contracted compared to the previous days' fluctuations of over a thousand points. This clearly shows a decay of momentum, with the market shifting from a possible trend sprint (whether upwards or downwards) to a state of oscillation exhaustion, where both bulls and bears are testing, but neither is willing to take the initiative.Bullish vs bearish strength comparison:
On-chain data: The sentiment is very interesting! The Fear and Greed Index is currently only at 14, indicating "extreme fear," and looking at historical records, it has lingered in the extremely low range of 10-23 over the past week. This is often a contrarian indicator, meaning the market sentiment is overly pessimistic, which may brew a rebound. Bitcoin's dominance is as high as 56.45%, indicating that funds are still highly concentrated in Bitcoin, and the altcoin season may not have truly arrived yet. The total market capitalization is $2.5 trillion, with a 24-hour change of +0.47%, indicating that the overall market is in a state of slight upward stagnation. Overall, on-chain sentiment is in extreme fear, but funds have not significantly flowed out of Bitcoin, presenting a contradictory state of "fearful holding."
News dynamics: I have distilled three core points. The first is that institutions are continuously increasing their holdings (bullish), with significant withdrawals from Coinbase for BlackRock's ETF and Lombard activating its BTC custody scheme, both indicating solid demand from the institutional level, which serves as mid-term support. The second is macro uncertainty (bearish/neural), with the Federal Reserve likely to maintain high interest rates, and geopolitical risks; these factors are short-term suppressing the upward space of risk assets, making the market hesitant. The third is internal market dynamics (bullish and bearish interweaving), where Bitcoin CEX balances have hit a new low (possibly bullish, meaning reduced selling pressure), but at the same time, there are large futures trades lurking before key news (increasing volatility risk). Overall, the news dynamics have intertwined bullish and bearish factors, with no one-sided driving force.
Resonance and divergence: The current oscillation pattern on the technical side resonates highly with the intertwined bullish and bearish news. The on-chain extreme fear sentiment and the slightly strong oscillation on the technical side (the price has not plummeted) create a degree of divergence, which is worth our attention, as it may suggest that selling pressure has been partially released.
The path of least resistance for trading:
In summary, the market is in a balanced oscillation phase. In the oscillation range, buying low and selling high is the direction with relatively less resistance. 👉 Therefore, it is recommended to adopt a range trading strategy, mainly waiting and seeing, and to act only when the price reaches the boundaries of the range.Key entry zones: For short-selling, focus on the 71000-71200 area (reference the 1-hour chart high of 71291.7, 71272.87); for long positions, focus on the 70500-70300 area (reference the 15-minute chart low of 70518.81, 1-hour chart low of 70321.51).
Stop loss basis: For short positions, place the stop loss just above the upper boundary of the range, around 71400; for long positions, place the stop loss just below the lower boundary of the range, around 70100. The basis for this is that the price needs to effectively break through the oscillation range to confirm a new direction.
Target zones: Aim for the other side of the range, with the short target at 70500 and the long target at 71000. In an oscillation market, it is not advisable to be greedy.
Conclusion and golden sentence:
The core contradiction in the current market is: the tug-of-war between the on-chain extreme fear sentiment and the price's resilience against declines, as well as the short-term suppression of institutional incremental funds by macro uncertainty.
Today's golden sentence is: ✨“In the oscillation amidst the fog of fear, it is precisely to wash away the floating chips, waiting for the next beacon of consensus.”✨ This echoes the phenomenon of institutions quietly increasing their holdings while the market is in widespread panic.
[Qinglan's personal view]
I feel that the market is like a tight spring, the on-chain sentiment has been pushed to the extreme, but the price just won't drop much, indicating that "hard assets" are being picked up below. Institutions (like BlackRock) aren't idle; they are quietly collecting chips while everyone is fearful. However, the "high interest rate" spell from the Fed is still in place, which means the spring won't bounce high all at once. So, it's highly likely that we will continue to grind, and we need more patience, waiting for one side to truly break this oscillation range. Pay attention to the defensive strength at the 70500 position; if it repeatedly fails to break down here, once sentiment warms up, the strength of the rebound may surprise many.
For more quantitative breakdowns of how real-time news affects market sentiment, it has been updated in my Qinglan Crypto Classroom: www.qinglan.org
免责声明:本文章仅代表作者个人观点,不代表本平台的立场和观点。本文章仅供信息分享,不构成对任何人的任何投资建议。用户与作者之间的任何争议,与本平台无关。如网页中刊载的文章或图片涉及侵权,请提供相关的权利证明和身份证明发送邮件到support@aicoin.com,本平台相关工作人员将会进行核查。