Crypto Circle Academician: 3.26 Ethereum Converging Triangle Change of Trend is Coming, One K Line Determines Everything! Latest Market Analysis and Thought Reference
Ethereum's current price is 2165, ETH is currently stuck at 2165, neither going up nor down, don't be deceived! This is not building a bottom; it's a consolidation after a drop, the long-term downtrend has not changed at all. The MA60 moving average is pressing down from above, unable to push north, gathering strength to the south, the next K line will determine the direction. Blindly bottom fishing or chasing highs can easily lead to losses, following the trend is the real way.
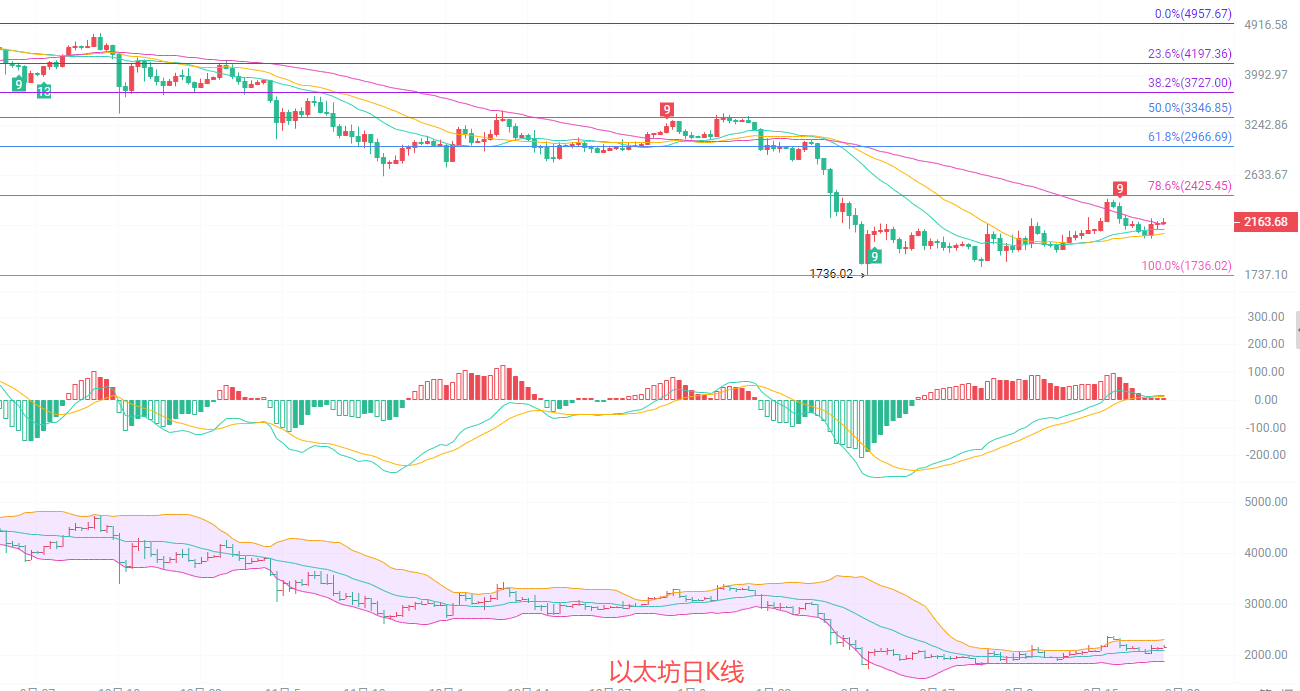
The daily bearish framework remains unbroken, the long-term trend is still bearish, the K line dropped from the high of 2385, rebounding to the Fibonacci 0.786 resistance level of 2425 but encountered resistance and fell back. Currently, it is grinding a bottom around 2165 and has not broken through the previous downtrend line, which is a technical correction after an overshoot. Although the MACD red bars have been expanding, the DIF is still hovering near the zero axis, with insufficient upward momentum, while the downward trend still holds the dominance. Additionally, the current K line is under pressure near the MA60 line around the 2144 moving average, and the bearish arrangement of the moving averages has not been completely broken.
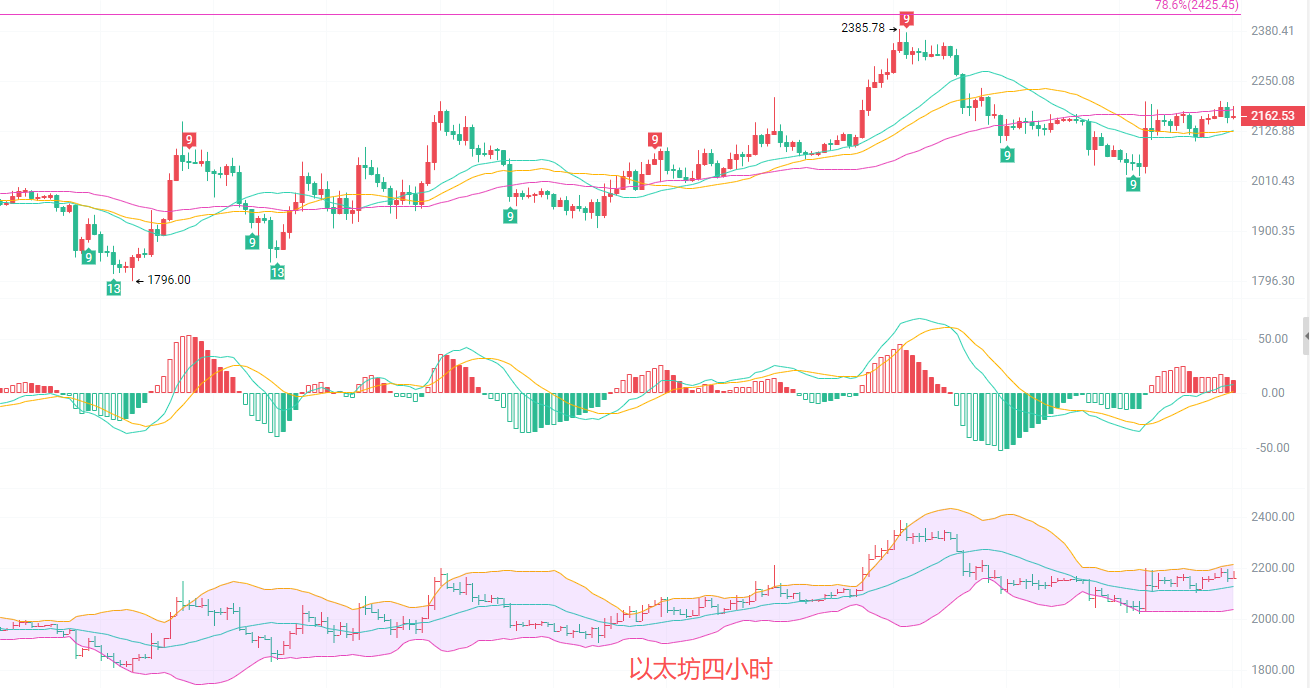
The four-hour change window has opened, with the K line falling from the 2385 high, gradually raising the lows and lowering the highs, forming a converging triangle consolidation pattern, with the fluctuation range continuing to narrow. The MACD red bars continue to shrink, and there are signs of a death cross between DIF and DEA as the upward momentum is diminishing. The key triangular upper resistance is at 2200, and the lower support is at 2100. Once either side breaks through, be prepared for both possibilities, safety first.
Short-term reference: (Practical data has been updated, for details consult the author)
Downward from 2120 to 2100, stop loss at 2050, target looking at 2160 to 2180.
Upward from 2180 to 2200, stop loss at 2245, target looking at breaking below 2100 down to 2080 to 2050.
Specific operations are based on real-time market data. For more information, details can be consulted with the author. There may be a delay in the article release; it is recommended only for reference and the risk is bearable by oneself.

Friendly Reminder: The above content is solely created by the author’s public account. The ads at the end of the article and in the comments section are not related to the author. Please be cautious and discern carefully. Thank you for reading.
免责声明:本文章仅代表作者个人观点,不代表本平台的立场和观点。本文章仅供信息分享,不构成对任何人的任何投资建议。用户与作者之间的任何争议,与本平台无关。如网页中刊载的文章或图片涉及侵权,请提供相关的权利证明和身份证明发送邮件到support@aicoin.com,本平台相关工作人员将会进行核查。