BTC price has been fluctuating around 71300, indicating that market prices are not unified. Currently, there is a battle between bulls and bears. The main institutions have neither increased trading volume nor decreased it. The reason lies in the uncertainty of the market environment, the impact of wars in multiple countries, and unclear situations. It is essential to seize opportunities for volume trading and follow the trend while managing our own positions.
Trend Analysis:
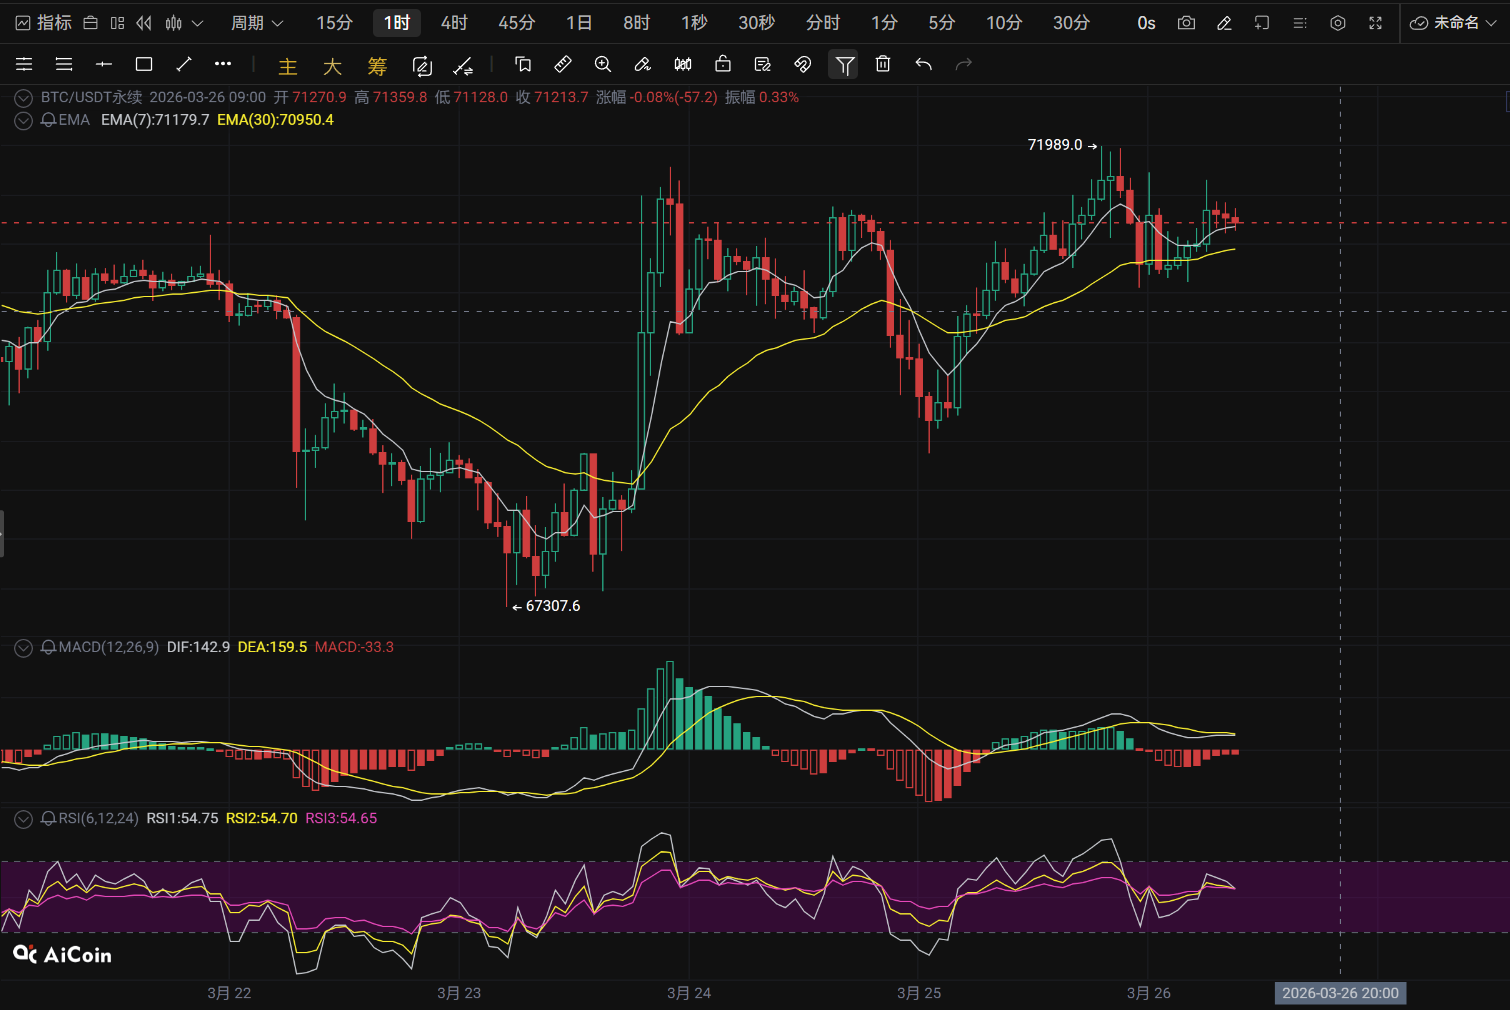
Candlestick Pattern:
Recently formed a double top structure (71931 and 71606) on the 1-hour level, with the current price fluctuating near 71200, and we need to be alert to the risk of breaking key levels. On the daily chart, after the long lower shadow on March 23, it continued to close positive for three days, but after reaching a high of 71999 on the 25th, it fell back leaving a long lower shadow, indicating heavy selling pressure above 71500.
Technical Indicators:
MACD: On the 1-hour level, the DIF (144) crosses below the DEA (159), and the histogram is negative; the daily level golden cross remains but the momentum is weakening.
RSI: The 1-hour level is at 56, in a neutral zone, with no signals of overbought or oversold; the daily level is at 52.4, also neutral but slightly weak.
EMA: On the 1-hour level, the price stabilizes at (70952), but (71186) is flat; on the daily level, (70703) is about to cross above (70545).
Trading Volume:
On the 1-hour level, key positions show obvious volume expansion; on the 25th at 20:00 during the sharp decline, the trading volume was 16690, and on the 26th at 00:00, it rebounded to 15026. The daily level on March 25 had a trading volume of 16516 compared to the previous day, but the price closed with a long upper shadow, showing characteristics of high-level selling pressure.
Summary: Although the volume has increased compared to the previous two days, there has not been much change in price, which requires caution against sudden price movements. The reason: the battle between bulls and bears deepens, and both sides have strong defenses without a clear winner. The focus lies on attack and defense. If it breaks the support line below 70000, go short; if it breaks the level of 72000, go long. Act in accordance with the trend. We may choose not to trade, but if we do, let’s manage our positions well and start executing profit-taking orders.
Strategy Suggestions:
Long Entry Points: 69500-69600
Stop Loss Level: 68500-68600
Take Profit Level: 71500-71600
Short Entry Points: 72500-72600
Stop Loss Level: 73500-73600
Take Profit Level: 70500-70600
(Strategy suggestions are for reference only; may everyone take profits, communicate, and place orders. Earth ID: g18607105568)
免责声明:本文章仅代表作者个人观点,不代表本平台的立场和观点。本文章仅供信息分享,不构成对任何人的任何投资建议。用户与作者之间的任何争议,与本平台无关。如网页中刊载的文章或图片涉及侵权,请提供相关的权利证明和身份证明发送邮件到support@aicoin.com,本平台相关工作人员将会进行核查。