Okay, students, we meet again! I am Sister Qinglan. Today we will break down and analyze the data at hand to see what story the market is telling. Remember, we only look at the data to speak, no guessing or speculation.
Market Structure Identification: The "Twisting" State Across Multiple Cycles
Let's start from the big picture and then look smaller. On the daily chart, the latest closing price is 71302.55. Looking back, the high point is 72026.09, and the low point is 70408.0. The price is oscillating back and forth in the range of 70000 to 72000, and the moving averages are interwoven, so at the daily level, it is clearly a fluctuating structure with an unclear direction.
Now looking at the 4-hour chart, the situation is quite interesting. The latest closing price is 71302.55, while the most recent significant high is 72026.09, and the significant low is 70530.47. The price has bounced from the low point but has not yet broken through the previous high, overall maintaining a fluctuating structure within a potential ascending channel, but a breakthrough at 72026.09 is needed for confirmation.
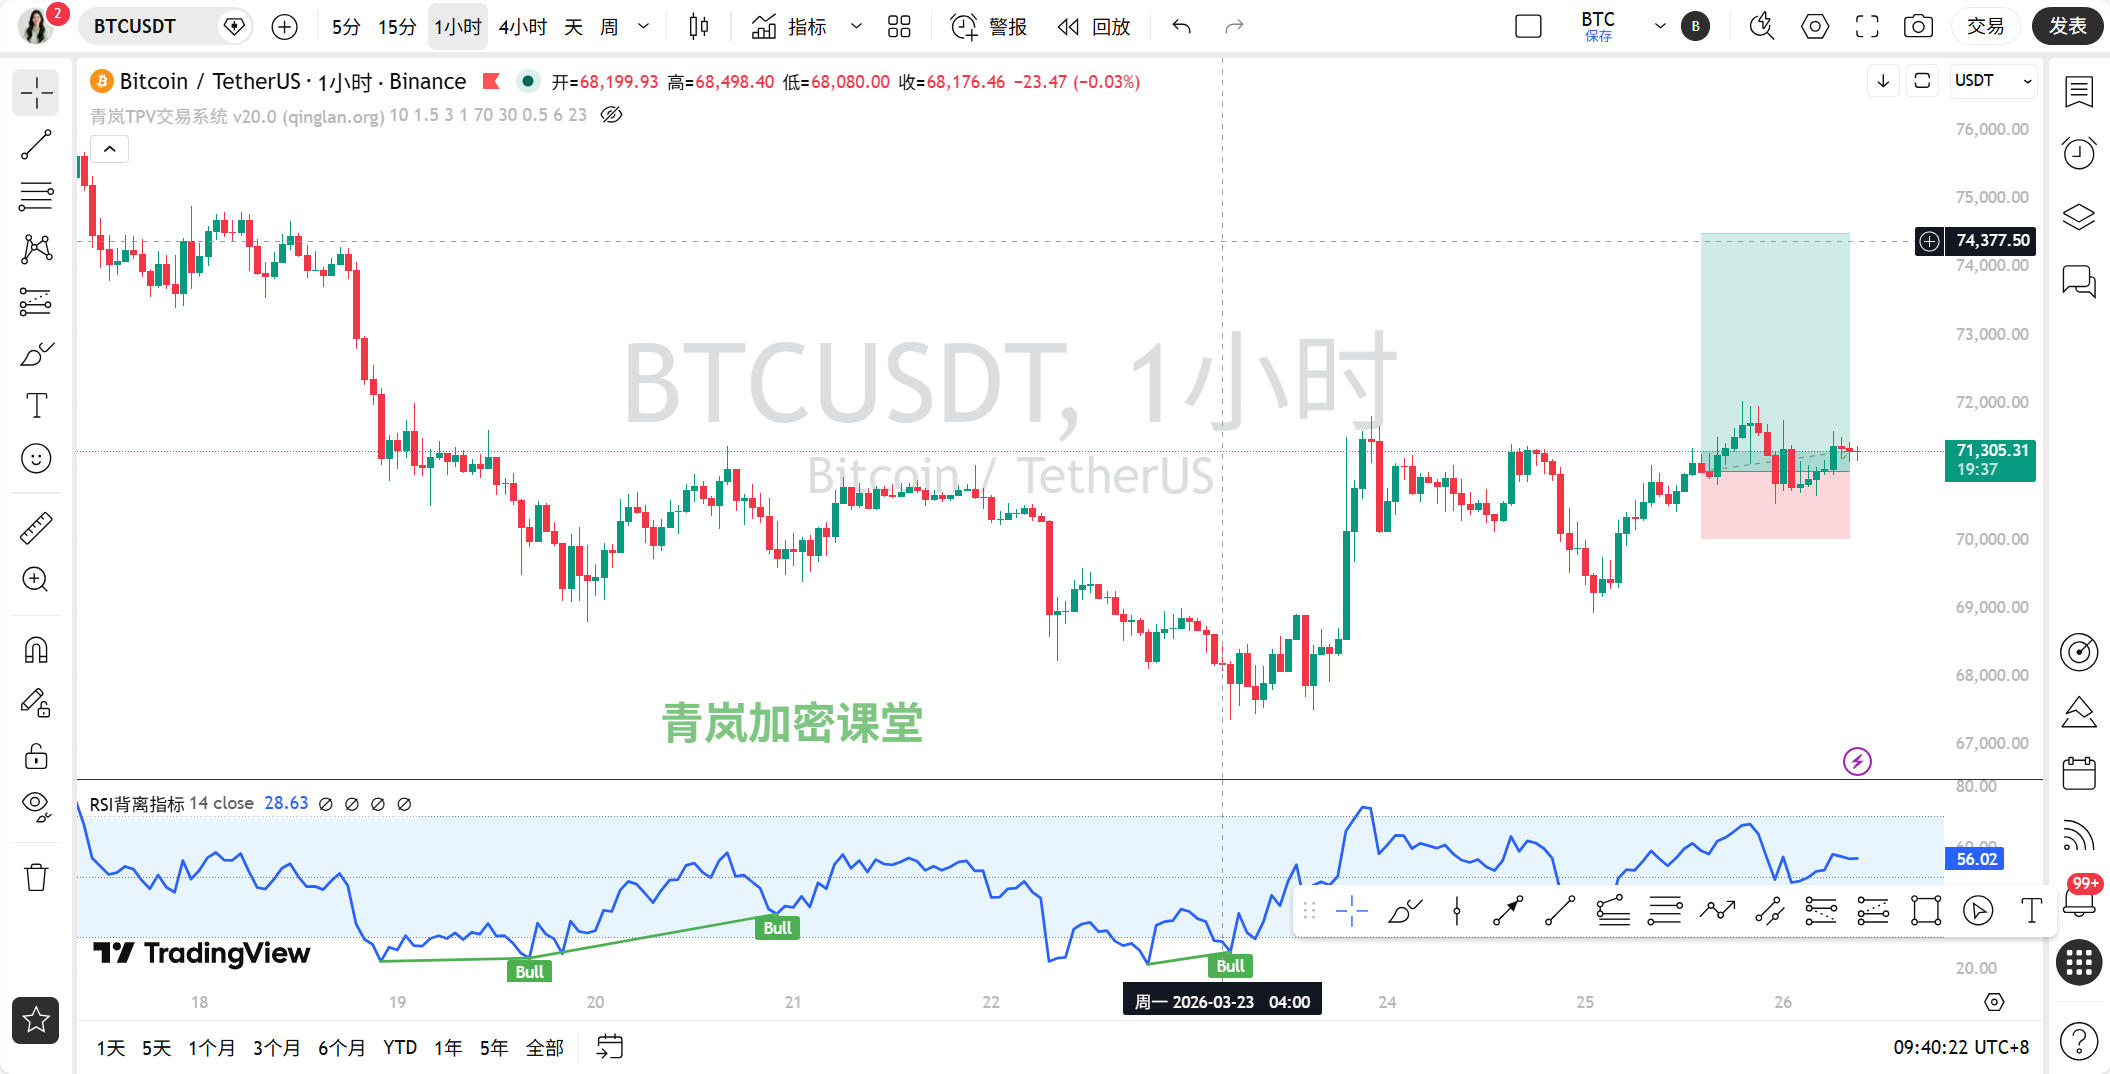
The 1-hour chart is even more interesting. Looking at the latest 20 candlesticks, the high point is 71594.11, and the low point is 70947.61. The price has been consolidating in this approximately $650 range for a while, forming a very standard fluctuating range. Therefore, the 1-hour chart shows a clear fluctuating structure.
Finally, looking at the 15-minute chart, it resembles the micro-fluctuations within the 1-hour oscillation. The latest price is 71302.55, with a recent high of 71436.82 and a low of 71142.38, with further narrowing fluctuations.
To summarize: the market from daily to 1-hour presentations shows a general trend of fluctuation, like a punch hitting cotton, lacking a clear directional breakthrough.
Key Levels and Price Rejection Signals
During the recent fluctuations, several levels have been repeatedly tested. On the 1-hour chart, around 71500 (such as the high of 71594.11) and around 71000 (such as the low of 70947.61) form clear boundary limits. Let's check for any nice rejection signals.
In the latest candlesticks on the 1-hour chart, there have indeed been tests. For example, the price once surged to 71594.11 (the highest price series) but closed back down to 71369.08 (the closing price series), leaving an upper shadow indicating pressure above. Similarly, there was a rebound after receiving support near 70947.61 (the lowest price series). However, based on the candlestick patterns presented by the data, there has not been a textbook-level long shadow Pin Bar or a strong bullish engulfing/bearish engulfing pattern. Therefore, Sister Qinglan's judgment is: typical price rejection patterns have not been identified, and the market is more testing boundaries through the accumulation of small-body candlesticks.
Volatility Nature Assessment: "Small Steps" in Fluctuation
Let's examine the fluctuations in the most recent 10 15-minute candlesticks. Taking the last 10 based on closing prices, from 71299.27 to 71302.55, the price hardly moved. The bodies are very small, like from 71355.88 to 71299.27, where the body is only about $56. The lengths of the shadows are also limited, with upper and lower shadows mostly within tens of dollars. This kind of "small steps" fluctuation, combined with the identified fluctuation structure, clearly points to the current market being in a state of fluctuation exhaustion, where both bulls and bears are waiting for new catalysts to break the balance. This is not a trend sprint but rather the calm before the storm.
Comparison of Bullish and Bearish Strength: Emotional Freezing Point and Technical Divergence
In terms of on-chain data, the amount of information is considerable. First, the fear and greed index is only at 10, indicating an "extreme fear" state, and it has been hovering around 10 recently. This shows that market sentiment is very pessimistic, and retail investors may have either refrained from entering or are cutting losses. However, interestingly, BTC's dominance is as high as 56.59%, and funds have not massively fled from Bitcoin. The total market cap is $2.52 trillion, with a 24-hour change of +0.59%, indicating that the market is overall in a slightly rebounding stalemate. This creates a typical "emotional freezing point with no significant capital flight" divergence scenario, which could often be one of the signals that the market is nearing a stage bottom.
As for the news aspect, we derive three core points. The first is "weak demand," with multiple reports mentioning that Bitcoin is being blocked at $72000, and on-chain demand indicators are weak, which is a short-term bearish factor explaining why the price can't rise. The second is "institutional actions," Morgan Stanley's Bitcoin ETF has been approved for listing, and Franklin Templeton is promoting tokenized products, both are medium to long-term institutional positives that bring fresh capital to the market, but the effects will take time. The third is "high leverage risk," with reports indicating that some whales are using 40x leverage for long or short positions and being liquidated, which exacerbates the market's short-term volatility and fragility.
In summary, the technical aspect (multi-cycle fluctuation) and the news aspect (short-term bearish and medium-to-long-term bullish factors coexisting) have not formed a unilateral resonance but are in a complex tug-of-war state. The emotional aspect (extreme fear) and the technical aspect (fluctuation not breaking out) have shown a noteworthy divergence.
Least Resistance Trading Direction: Wait for Breakout and Follow the Trend
Based on the above analysis, Sister Qinglan believes that the wisest course of action now is to "observe," waiting for the market to choose its direction. Because trading within a fluctuating range can easily lead to being hit in both directions.
If a plan must be made, we can layout as follows:
Key entry zone: Patiently wait for the price to effectively break the 1-hour chart fluctuating range. A breakout above and a stable position above 71594.11 (1-hour chart recent high) could consider a small long position; a breakdown and close below 70947.61 (1-hour chart recent low) could consider a small short position.
Stop-loss basis: For long positions, place the stop-loss below the lower edge of the breakout range, around 70800; for short positions, place the stop-loss above the upper edge of the range, around 71700. Specific adjustments should be made based on the candlestick patterns during the breakout.
Target areas: If there is an upward breakout, the first target could be around the 4-hour chart previous high of 72026.09, and further the upper edge of the daily fluctuation range. If there is a downward breakout, look towards earlier low areas in the 1-hour chart, such as 70530.47 or even around 70200.
Remember, at the end stage of fluctuations, false breakouts are common; be sure to wait for a price closing confirmation (at least the 1-hour candlestick close) before acting.
Conclusion and Golden Sentence
The current core contradiction in the market is the tug-of-war between the extremely fearful retail sentiment and the standoff of bullish and bearish technical patterns.
A golden sentence for everyone: The market builds a bottom in despair, rises in hesitation, and concludes in a frenzy. When the news is all saying "weak demand," perhaps we should listen to the silent language of the candlesticks.
[Personal View of Qinglan]
I personally feel that the market now is like a tightly strung bow. The on-chain sentiment has cooled to the extreme, but the price just doesn't drop deeply, repeatedly rubbing against key support, which usually is not a bad thing. Those high-leverage players have been cleaned out, creating space for healthier trends to follow. The institutional positives are substantial, but they need time to ferment. What we need to do now is not to guess the bottom but to prepare our ammunition and wait for the market to self-generate a clear directional signal. Remember, good traders spend most of their time waiting.
More quantitative analysis on the impact of real-time information on market sentiment has been updated in my Qinglan Crypto Classroom: www.qinglan.org
免责声明:本文章仅代表作者个人观点,不代表本平台的立场和观点。本文章仅供信息分享,不构成对任何人的任何投资建议。用户与作者之间的任何争议,与本平台无关。如网页中刊载的文章或图片涉及侵权,请提供相关的权利证明和身份证明发送邮件到support@aicoin.com,本平台相关工作人员将会进行核查。