Cryptocurrency Analyst: Bitcoin fell again on March 27! Those who bought high are crying, and those who shorted are laughing! The next target has been clearly defined! Latest market analysis and strategy reference
Bitcoin is currently priced at 68,300. Looking at Bitcoin dropping from 71,500 to 68,200, are there still people hitting their thighs? Either they bought high and are trapped above 71,000, or they sold at a loss below 69,000. In fact, this wave of market performance has been scripted long ago. I previously provided a strategy southward at 71,500, targeting directly at 69,000, and now the price has fallen below 68,500, completely confirming the judgment. The cryptocurrency market has never relied on luck to make money; understanding trends and executing strictly is the only way to earn when others are panicking.
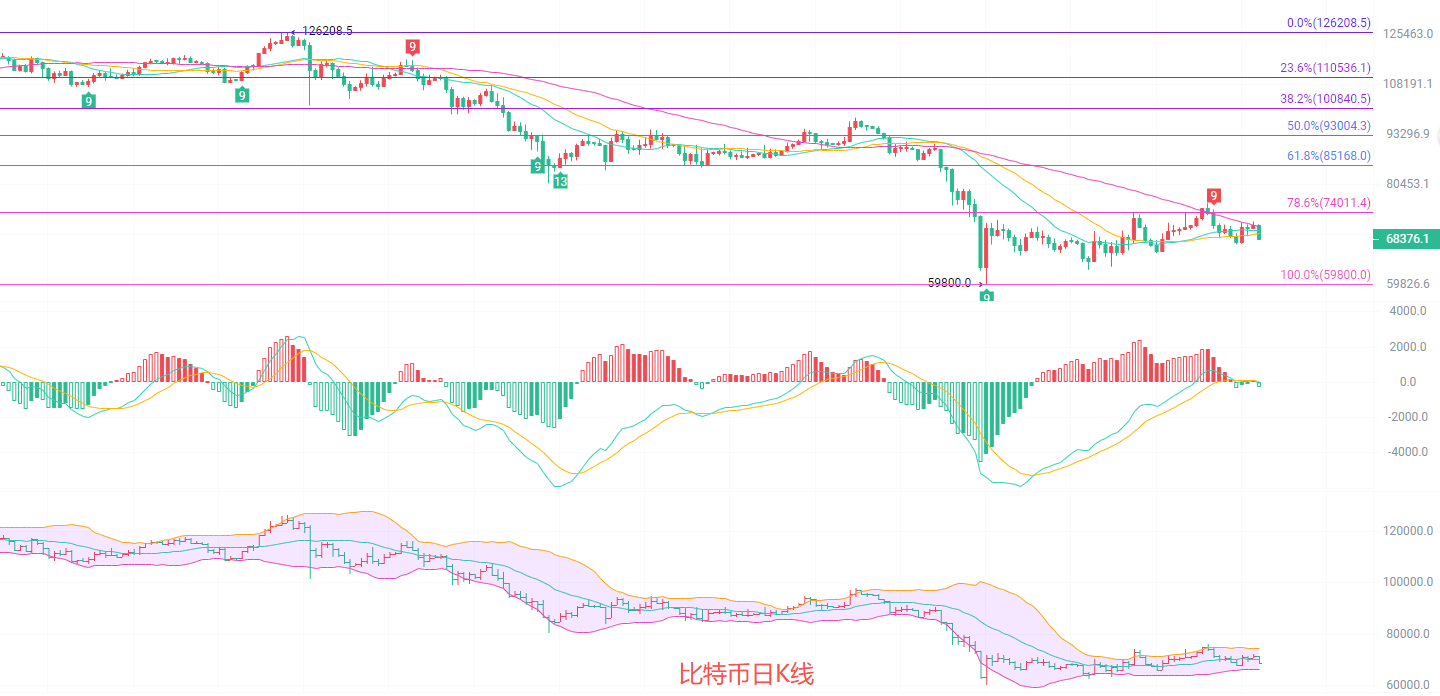
Since the high point on the daily chart has retreated, it has always been pressured below the short-term moving averages. MA20, MA30, and MA60 have formed a complete downward arrangement, and the upward momentum in the medium term has completely exhausted. After the MACD death cross, the green bars continue to enlarge, and the downward momentum is constantly accumulating; the Bollinger Bands are opening downward, with prices running close to the lower track, indicating a clear downward trend. The 71,000 level has turned from support to strong resistance, with the first support below seen at 68,000. If it breaks, attention will shift to the 65,000 to 59,800 range, and the downward trend on the daily chart will continue.
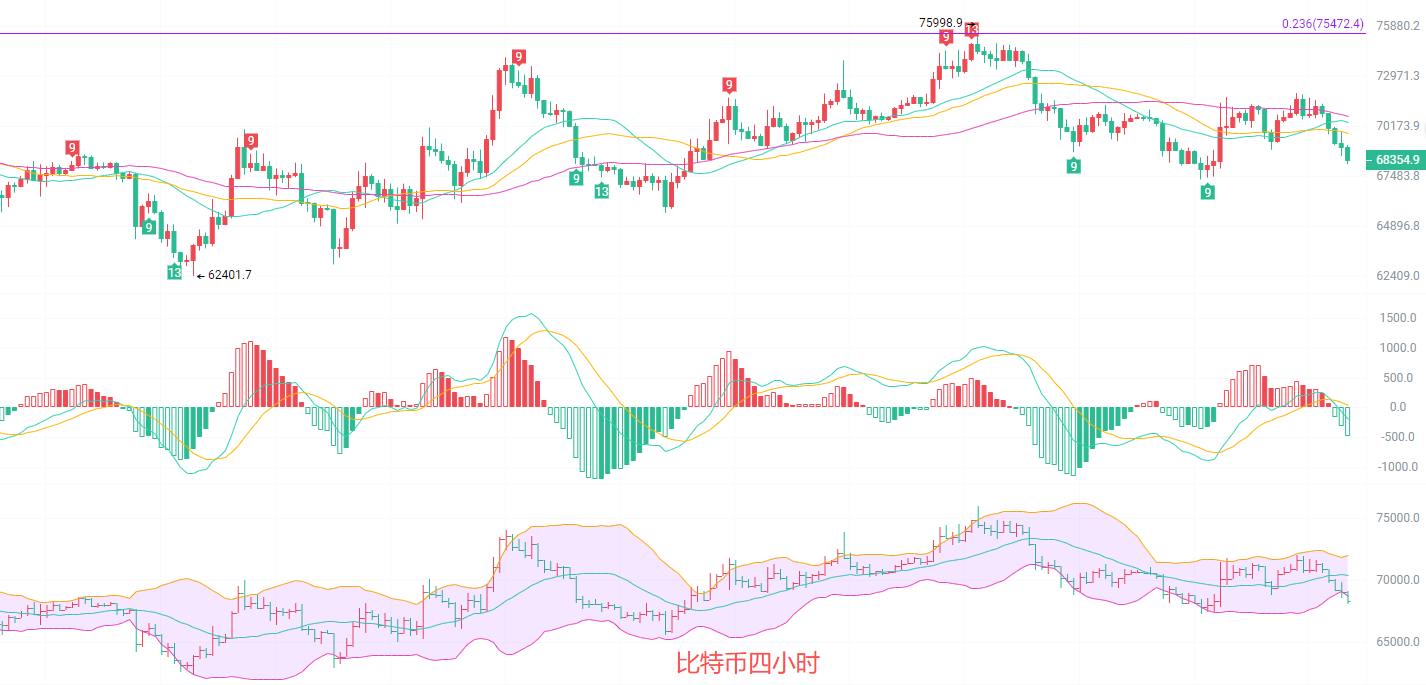
The four-hour chart has broken below the converging triangle's lower support at 69,000, confirming a downward break, with the trend direction entirely pointing south. Prices are pressured below the MA20 and MA30 moving averages, forming a downward arrangement in short-term moving averages; after the MACD death cross, the green bars continue to increase, and the DIF and DEA are moving down together, with ample downward momentum. The Bollinger Bands are opening downward, with prices running close to the lower track, indicating a clear downward trend. The upper level at 70,000 is a short-term resistance level, while the lower level at 68,000 is the first support level. The downward trend on the four-hour level will continue.
Short-term strategy reference: Follow the trend of the larger cycle, small stop-loss, quick entry and exit
Long positions from 68,300 to 68,000 with a stop-loss at 67,800, target looking at 69,000 to 70,000 cautiously moving north
Short positions from 69,000 to 70,000 in batches with a stop-loss at 70,500, target looking at 68,500 to 68,000, if broken, continue looking down to 65,000 to 60,000
In the cryptocurrency world, those who are ahead eat meat, those who are late drink soup, and those who are clueless take over.
Specific operations should be based on real-time market data. For more information details, please consult the author. The release of the article may be delayed, and the suggestions are for reference only; risks are to be borne by yourself.

Friendly reminder: The content above is solely created by the author of the official account. The advertisements at the end of the article and in the comments section are unrelated to the author; please discern carefully. Thank you for reading.
免责声明:本文章仅代表作者个人观点,不代表本平台的立场和观点。本文章仅供信息分享,不构成对任何人的任何投资建议。用户与作者之间的任何争议,与本平台无关。如网页中刊载的文章或图片涉及侵权,请提供相关的权利证明和身份证明发送邮件到support@aicoin.com,本平台相关工作人员将会进行核查。