Academician of Cryptocurrency: March 27 Ethereum 2180 South to Cash Out! How to Accurately Hit this Wave of Shorts? Latest Market Analysis and Thought Reference
Ethereum is currently priced at 2040. The recent trend of Ethereum has fully played out step by step according to our expectations. From the high point of 2385 retreating, to the converging triangle consolidation, and then south to layout at 2180, the price has now dropped to around 2040. From targets of 2120 and 2100 to 2040, every step has been accurately hit. Many friends have chased prices and sold low amidst the fluctuations, which essentially means they did not understand the structure. This wave of market action has pointed south from the very beginning; only most people have been confused by short-term volatility, missing out on certain profits. Now the trend has become clear, and the upcoming layout must be stable, precise, and fierce.
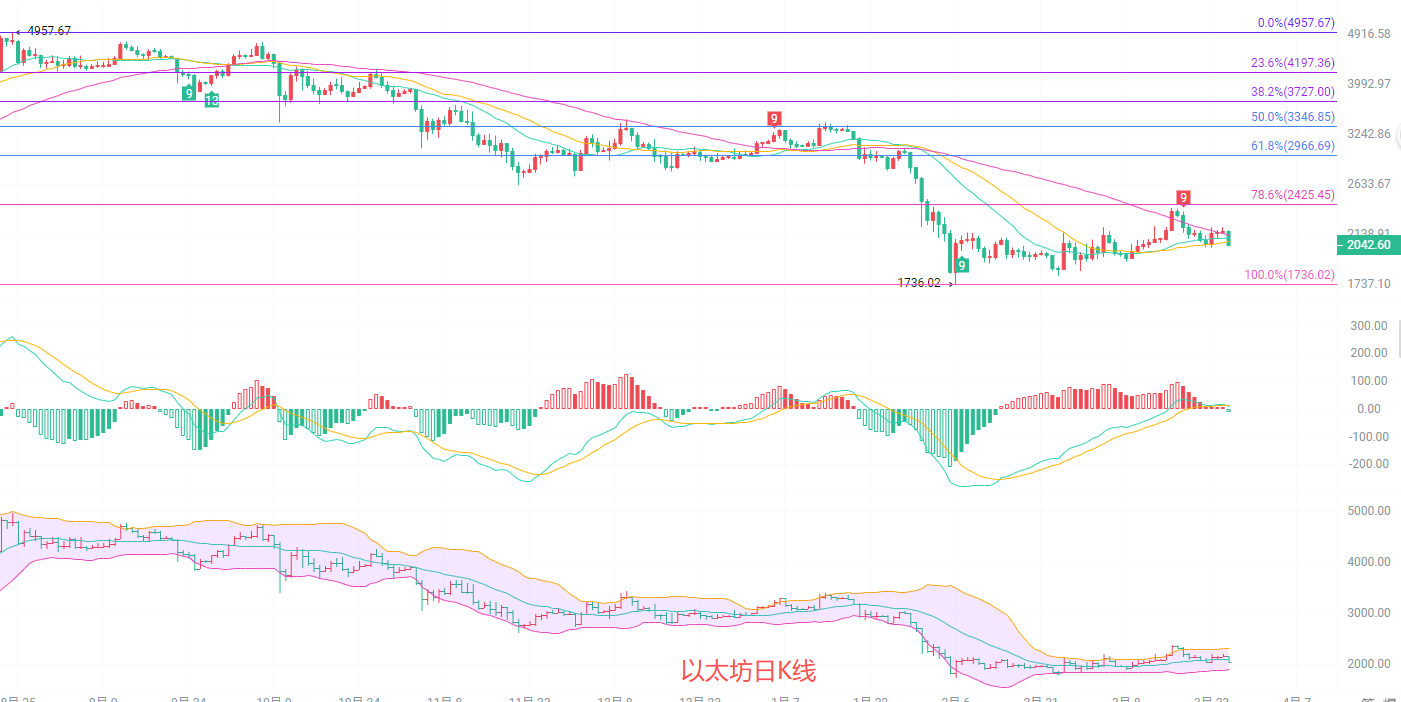
The daily K-line has given the clearest signal that this drop is not a correction but a trend-driven descent. After the price broke through the key support at 2100, all short-term moving averages turned downward, forming pressure. After the MACD dead cross, the volume continued to increase, indicating that the north has completely given up resistance. The lower Bollinger Band continues to open, and the price is descending along the lower band with no signs of stopping. The upper limit of 2120 is an insurmountable resistance level, while the lower limit of 1980 is the first target level; the daily downward space is still opening up.
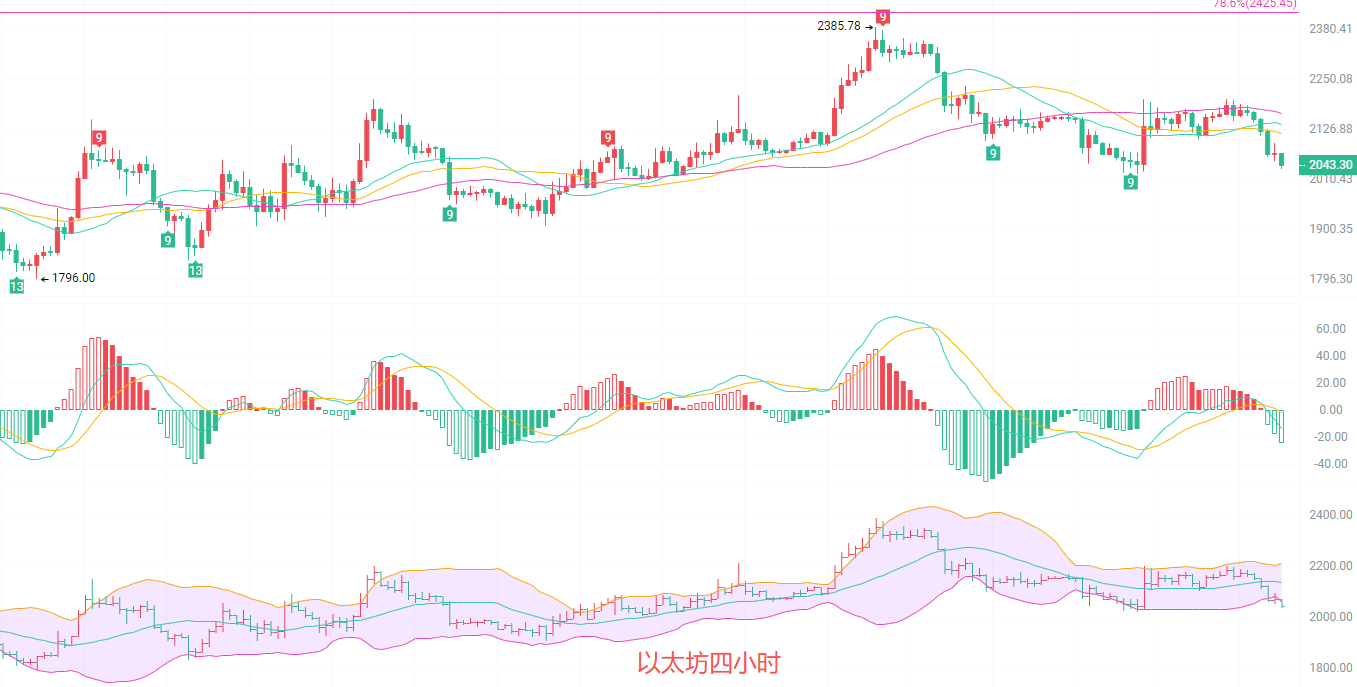
The four-hour chart has broken below the lower boundary of the converging triangle support at 2100, confirming the downward breakout, with the direction of the market thoroughly indicating a southern trajectory. The price is under pressure below the MA20 and MA30 moving averages, forming a downward arrangement in the short-term moving averages. After the MACD dead cross, green bars continued to increase, and the DIF and DEA moved downward in sync, indicating sufficient downward momentum. The Bollinger Band is opening downward, and the price is moving along the lower band with a clear downward trend. The upper limit of 2100 is a short-term resistance level, and the lower limit of 1980 is the first support level; the four-hour downward trend will continue.
Short-term Reference: (The practical data has been updated; please consult the author for details)
Selling south from 2080 to 2100, stop-loss at 2120, targets looking at 2000 to 1980
Buying north from 2000 to 1980, stop-loss at 1960, targets looking at 2050 to 2080
Specific operations depend primarily on real-time data from the market; more detailed information can be consulted from the author. There may be delays in the publication of articles, suggestions are for reference only, and risks are to be borne by individuals.

Kind Reminder: The above content is solely created by the author of the public account. The advertisements at the end of the article and in the comments section are unrelated to the author. Please discern carefully. Thank you for reading.
免责声明:本文章仅代表作者个人观点,不代表本平台的立场和观点。本文章仅供信息分享,不构成对任何人的任何投资建议。用户与作者之间的任何争议,与本平台无关。如网页中刊载的文章或图片涉及侵权,请提供相关的权利证明和身份证明发送邮件到support@aicoin.com,本平台相关工作人员将会进行核查。