Hello everyone, I am Sister Qinglan! Welcome to Qinglan's Crypto Classroom. Today, we will use my TPV three-point verification trading system to analyze the current Bitcoin market thoroughly, with practical real-world analysis!
Step 1: First, look at the big picture (multi-timeframe trend overview)
Let's sort out the states of the four timeframes:
1-day chart: The closing price is 68910.35. The moving averages are MA5=70106.08, MA10=69899.48, MA30=69668.02, showing a bullish arrangement! But the price is now at 68910.35, having fallen below all short-term moving averages, indicating that the daily level is actually in a pullback. On-chain sentiment is "extreme fear," with an index of only 13, which diverges somewhat from the bullish arrangement of the larger timeframe, indicating that market sentiment is very fearful.
4-hour chart: Closing price 68910.35. The moving averages are MA5=68924.73, MA10=69868.54, MA30=69836.62, entangled moving averages; the price is struggling near these averages. Sentiment is also influenced by extreme fear, with fierce contention between bulls and bears here.
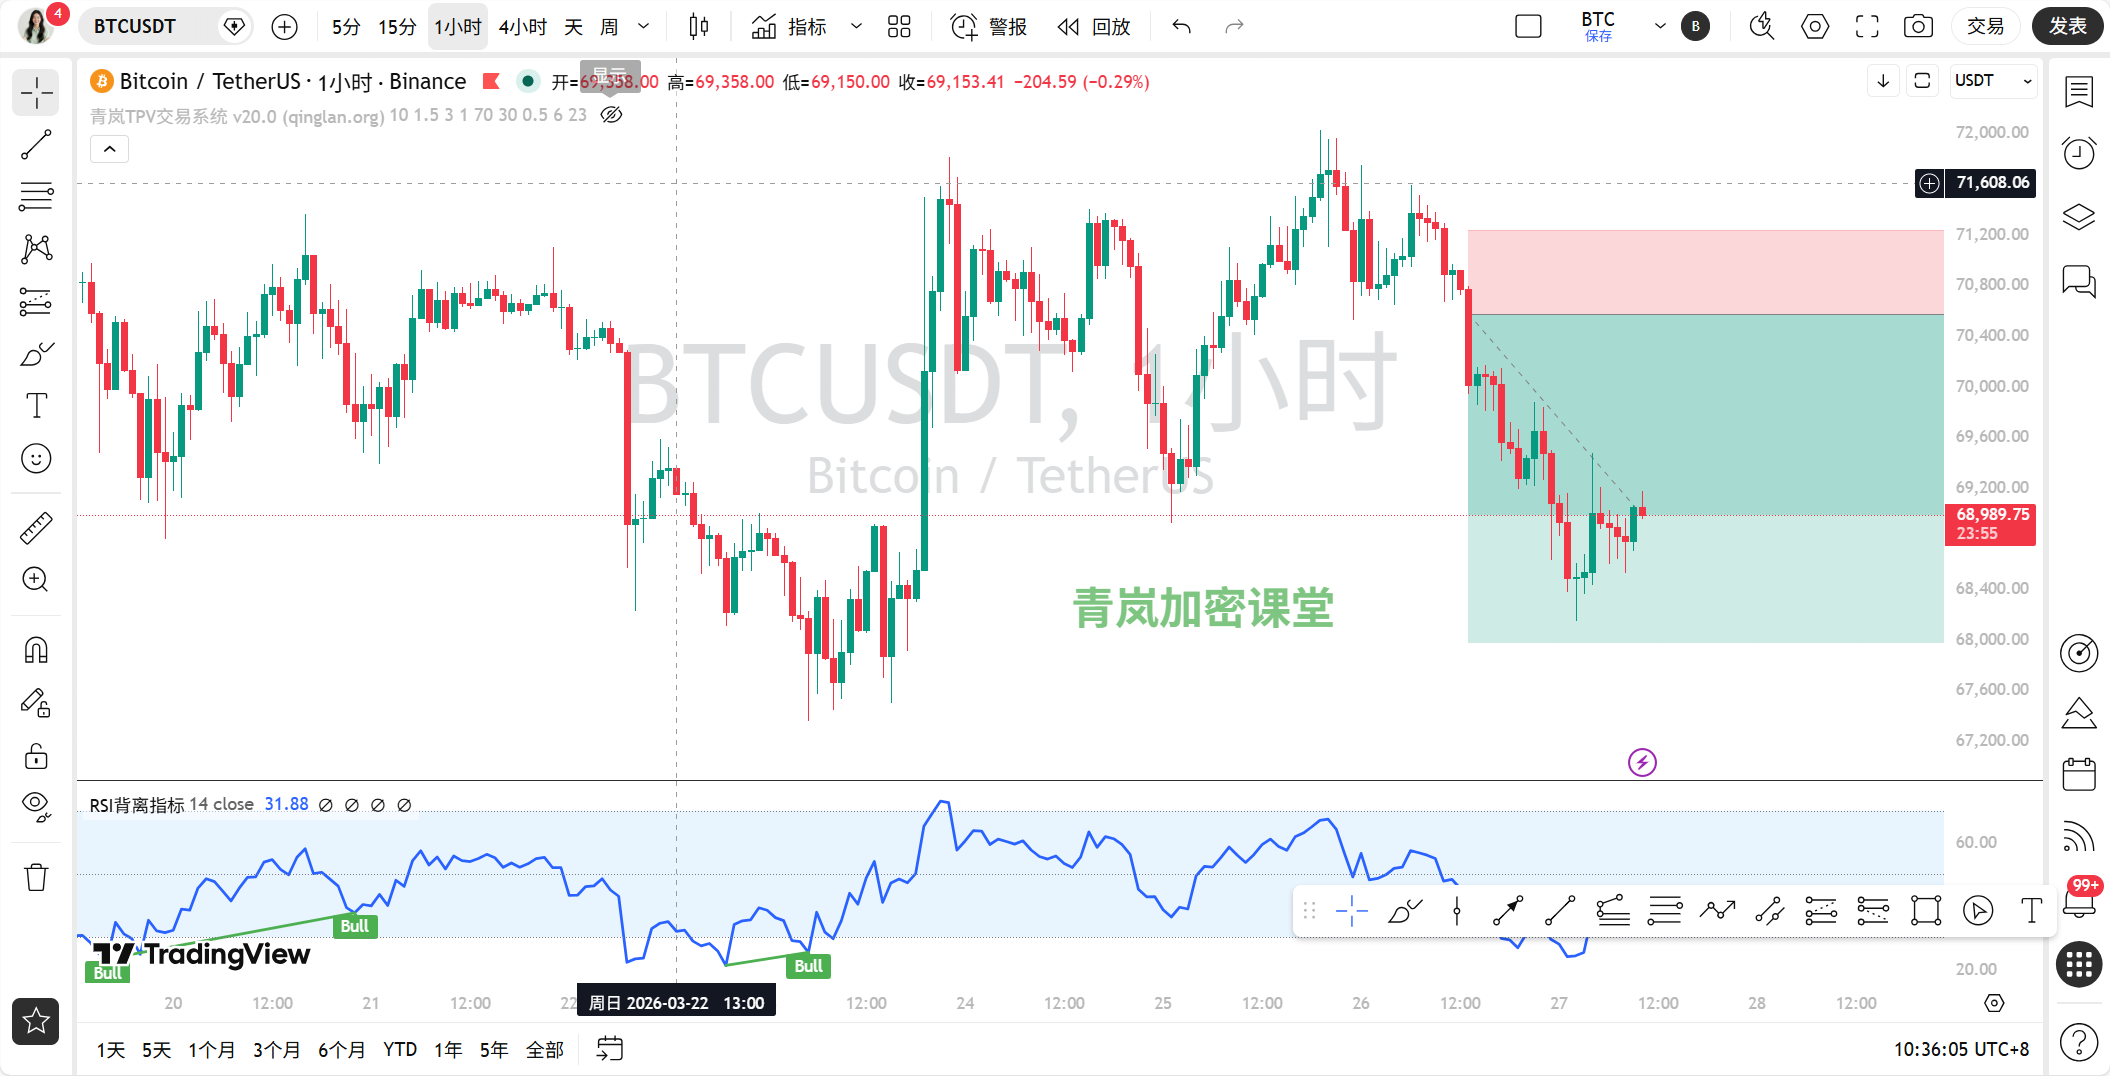
1-hour chart: Closing price 68910.35. The moving averages are MA5=68865.89, MA10=68778.56, MA30=69796.73, also entangled averages. The price is near the short-term moving averages but far below MA30, indicating a weak medium-term trend. News mentions "Bitcoin falls below 69,000," matching this timeframe's decline.
15-minute chart: Closing price 68910.35. The moving averages are MA5=68873.87, MA10=68833.54, MA30=68822.18, which is a beautiful bullish arrangement! But this is the smallest timeframe, indicating only signs of a short-term stabilization rebound, requiring confirmation from larger timeframes.
Step 2: Find pivot points and draw key lines (effective high and low points + trend lines)
Let’s identify the key prices for each timeframe:
1-day chart: The most recent effective high point is 72026.09 (from the highest price in the 1-hour data series, confirmed by the daily candlestick). The most recent effective low point is 68153.0 (from the lowest price in the 4-hour data series). The price is currently at 68910.35, in the lower part of this range.
4-hour chart: Effective high point is 71436.82 (from the highest price series in 4 hours). Effective low point is 68531.37 (from the lowest price series in 4 hours). A downward trend line can be drawn connecting recent high points, with the price currently below this trend line.
1-hour chart: Effective high point is 70968.66 (from the highest price series in 1 hour). Effective low point is 68531.37 (from the lowest price series in 1 hour). The price is fluctuating at a low level, forming a temporary range.
15-minute chart: Effective high point is 68950.0 (from the highest price series in 15 minutes). Effective low point is 68700.0 (from the lowest price series in 15 minutes). A very narrow range!
The news states, "James Wynn opens 40x leveraged BTC short, liquidation price at $70270.83," which is close to our 1-hour effective high area, indicating actions from bears near key resistance.
Step 3: Indicators for support (technical indicators verification)
1-day chart: MACD's DIF is -112.03, DEA is 54.08, histogram is -166.11, no golden or dead cross, but momentum is negative and bearish. RSI is 44.66, in a neutral to weak area. This verifies the daily level pullback.
4-hour chart: MACD's DIF is -315.42, DEA is -83.16, histogram is -232.26, momentum is down and bearish. RSI is 46.58, also neutral to weak. Consistent with the trend judgment.
1-hour chart: MACD's DIF is -450.12, DEA is -478.27, histogram is 28.15, although the bars are shortening (negative momentum weakening), both lines are deeply below zero, indicating overall weakness. RSI is 42.36, close to oversold but not quite.
15-minute chart: MACD's DIF is -15.62, DEA is -34.61, histogram is 18.99, bars turning positive, showing short-term rebound momentum. RSI is 58.38, back to neutral and slightly strong. This small timeframe indicator is the only one indicating bullishness.
Our TPV system's historical backtesting accuracy is 71.5%. The current entangled state of the large timeframe being bearish while the small timeframe attempts a rebound is often seen in historical backtesting during trend continuations or initial reversals, requiring extra caution for confirmation.
Step 4: Contest between bulls and bears (news + on-chain)
News:
There are many bearish factors! "Federal Reserve rate hike expectations are rising," "Bitcoin falls below 69,000," "Quarterly options expiration date approaches: BTC maximum pain at $75,000, market sentiment is bearish," "Over $32.26 million liquidated across the network in 1 hour, BTC liquidated $14.39 million leading the decline." The core factors are "quarterly options expiration" (maximum pain at $75,000) and macro rate hike expectations, putting direct pressure on the market.
There are also bullish factors: "Bitcoin's resilience is evident! JPMorgan: Gold and silver under pressure, funds continuously flow into BTC," "United States Bitcoin ETF net inflow of 86 BTC." But the strength of the positive news is clearly weaker than the negative news.
The current downward technical trend and negative news are resonating, both applying pressure.On-chain data:
The fear and greed index is only 13, indicating "extreme fear"! This shows that market sentiment has panicked to the extreme, which often suggests that it may be close to a short-term emotional bottom. BTC's dominance is 56.41%, still very high. Total market cap is $2.44 trillion, with a 24-hour change of -3.07%, indicating capital outflow. On-chain data (extreme fear, capital outflow) resonates with the technical decline.
Step 5: The path of least resistance (trading strategy)
Overall, the large timeframes (daily, 4-hour) trend bearish, with news and on-chain data also leaning bearish, while small timeframes (15 minutes) show an attempt to rebound but with unknown strength. Therefore, the current path of least resistance is likely still downward.
Recommendation: Wait and observe, or cautiously try to short on rallies.
If you want to short, key entry areas can refer to the effective high point near 70968.66 in the 1-hour chart, or the effective high point near 71436.82 in the 4-hour chart. Stop-loss can be set slightly above these prices.
Target areas can first look at recent low points, such as the effective low point of 68531.37 in the 4-hour chart, or even the effective low point of 68153.0 in the daily chart.
For longing, it is necessary to wait for the price to strongly break through and stabilize above key resistance levels (such as 70968.66 or 71436.82), while the small timeframe indicators strengthen in confirmation; otherwise, the risk is relatively high.
Step 6: Today's expected movement (market prediction)
Current (within a few hours): Likely to continue fluctuating in the range of 68531.37 to 69500; the bullish arrangement in the 15-minute chart may drive a small rebound, but there are heavy pressures above.
Today's and recent keys: The most important support level today is 68531.37; if it breaks, it may accelerate the decline to 68153.0. The most crucial resistance level is the 69500-70000 area, as well as the higher level of 70968.66.
Trading mindset: The most suitable approach now is to wait for a lack of strength in rebounds before shorting or following the short after breaking key support. This is because the larger environment and sentiment indicate bearish dominance. The only longing opportunity requires waiting for a clear bottom reversal signal.
Summary: The core contradiction in the current market is the conflict between extremely fearful sentiment and the demand for a potential technical oversold rebound.
Trading golden saying: Quarterly expiration weighs heavy, seeking price resilience amid fear; as mentioned in the news, real opportunities often brew during periods of extreme fear among the masses.
[Qinglan's Personal View]
Oh, looking at this data, Sister Qinglan feels that the market is currently like a frightened child, with one side being "extreme fear," and the other side being the small spark of a technical rebound. My personal feeling is to not rush to bottom fish, let the bullets fly a little longer. Wait for this panic sentiment to ease a bit, or for clearer reversal signals to appear, such as a volume breakout above a key resistance, then we can act more safely. Remember, when others are fearful, we should be prepared, but not rush into greed. The market always has opportunities; protecting the principal is the first lesson!
This TPV system is what I've refined over the years of monitoring, reviewing, and practical trading. I can't say it's 100% accurate, but at least it can give us more confidence at key positions. If you want to be the first to obtain the latest entry opportunities captured by my TPV system, welcome to visit the official website of Qinglan's Crypto Classroom at www.qinglan.org, see you in the classroom!
免责声明:本文章仅代表作者个人观点,不代表本平台的立场和观点。本文章仅供信息分享,不构成对任何人的任何投资建议。用户与作者之间的任何争议,与本平台无关。如网页中刊载的文章或图片涉及侵权,请提供相关的权利证明和身份证明发送邮件到support@aicoin.com,本平台相关工作人员将会进行核查。