Hello everyone, I am Sister Qinglan, welcome to the Crypto Classroom! Today, we will use my TPV three-point verification system to thoroughly analyze the latest market data, and see where the opportunities and risks are hidden.
Step 1: First, look at the big direction (Multi-Timeframe Trend Overview)
Let's examine from large to small:
Daily chart (large timeframe): Closing price 66566.68, price is below MA5 (67901.57) and MA10 (68825.89), moving averages are in a bearish arrangement. The overall trend is still weak.
4-hour chart: Closing price 66566.68, price hovering around MA5 (66638.92), MA30 (68797.39) is high above, indicating that the mid-term is still in a large adjustment structure.
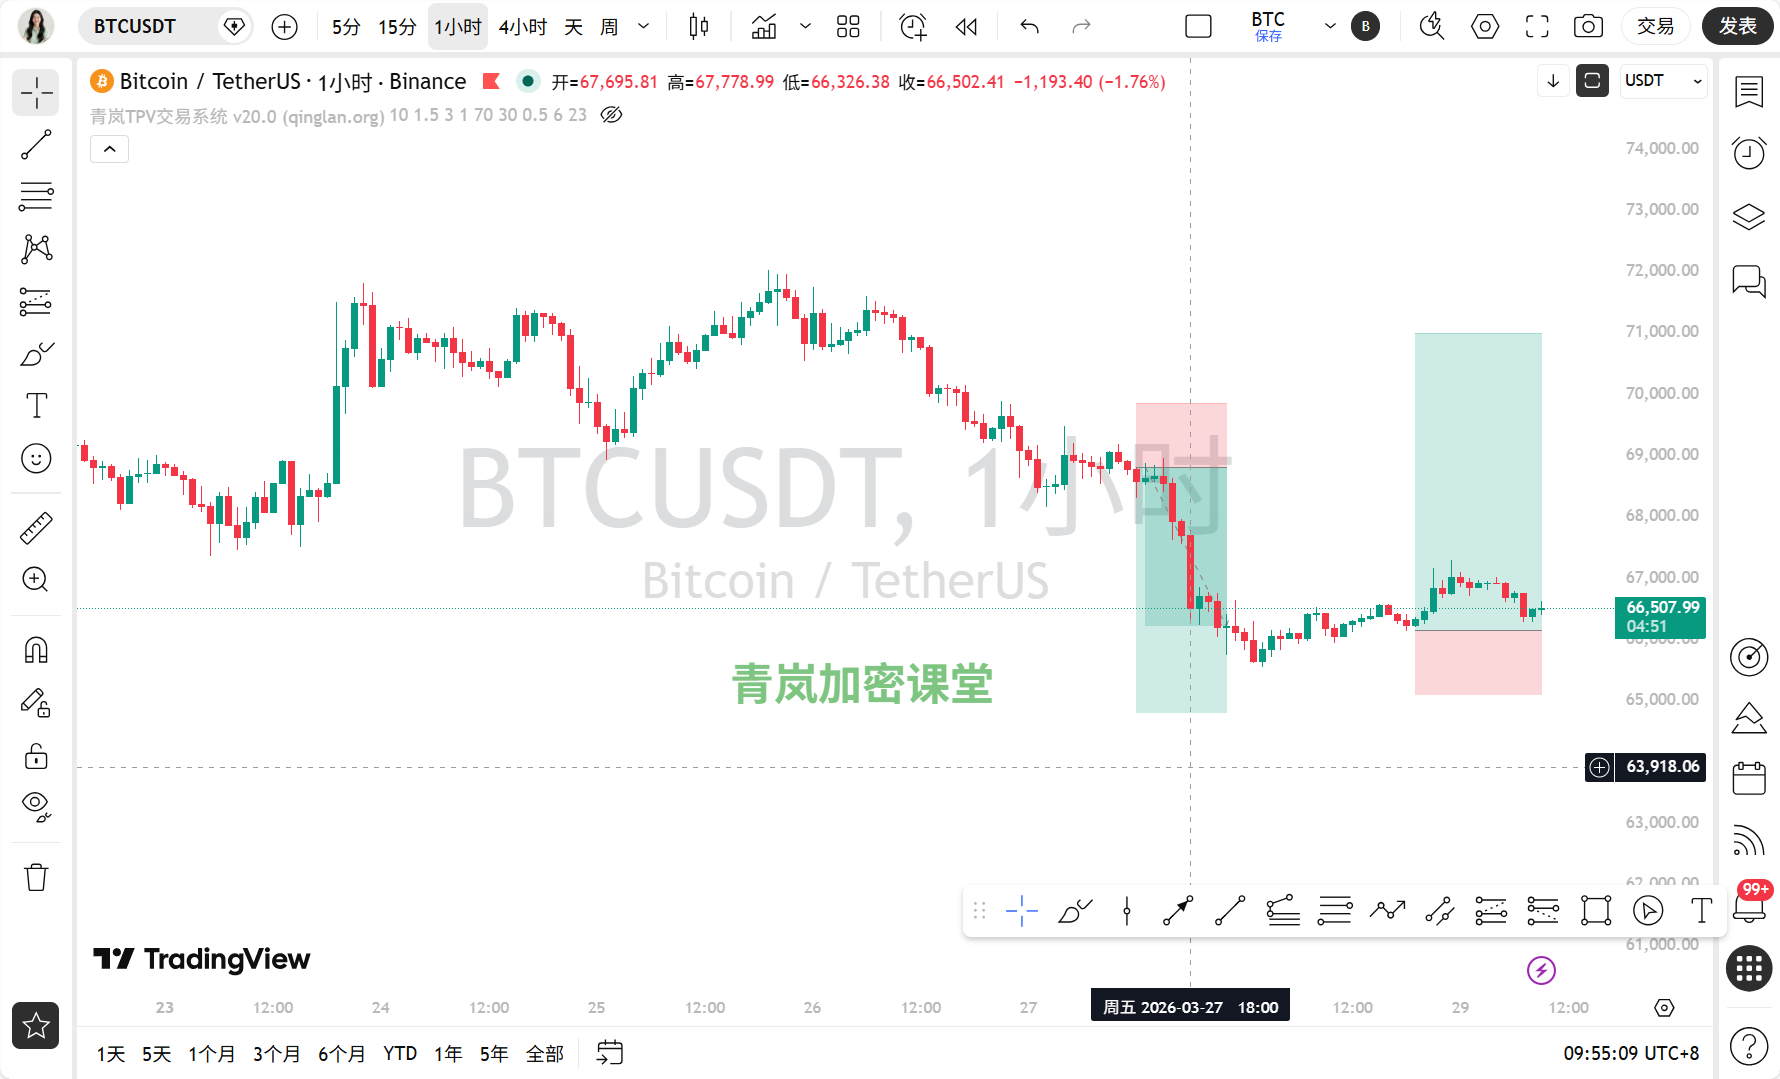
1-hour chart: Closing price 66566.68, price is around MA5 (66574.61) and MA10 (66737.68), moving averages are intertwined, short-term direction is unclear.
15-minute chart: Closing price 66565.38, price is near MA5 (66527.43) and MA10 (66461.52), also intertwined moving averages, a very tangled market.
On-chain sentiment influence: The Fear and Greed Index is only 9, indicating “extreme fear”! This sentiment is a typical “panic bottoming” signal for daily and 4-hour timeframes, but for smaller timeframes (1 hour, 15 minutes), panic can easily lead to sharp declines. Total market capitalization is 2.37 trillion, with a 24-hour change of 0.58%, trading volume is low, the market is overall very cautious.
Step 2: Find pivot points, draw key lines (Valid Highs and Lows + Trend Lines)
Let’s find the key turning points for each timeframe:
Daily chart: The most recent valid high point is at 68820.31 (confirmed by subsequent decline), and the valid low point is at 66377.03 (needs to be observed whether it can hold). The trend down from the high point is downward.
4-hour chart: Valid high point is at 67014.91, valid low point is at 66281.4. The price is currently stuck between the two.
1-hour chart: Valid high point is at 66916.52, valid low point is at 66281.4. Similarly, it is fluctuating within a small range.
15-minute chart: Valid high point is at 66835.1, valid low point is at 66377.03. The ultra-short term is oscillating within this range of less than 500 dollars.
Trend line: Currently, from the 4-hour and 1-hour views, prices are fluctuating within a converging range, and there is no particularly standard one-sided trend line. News such as "US-Iran tensions" and "Trump bullish" may have exacerbated the pull within this range.
Step 3: Indicators as support (Technical Indicator Verification)
Let's see what the indicators say:
Daily chart: MACD histogram is -514.97, green histogram is very long, bearish momentum is strong. RSI is 34.05, close to oversold area, but has not yet bottomed. This verifies the weakness of the large timeframe.
4-hour chart: MACD histogram is -35.03, also a green histogram, indicating bearish momentum. RSI is 32.70, already in the oversold area! Here, it is important to note that the price may not be able to fall further.
1-hour chart: MACD histogram is 8.22, red histogram is very short, both bullish and bearish momentum are weak. RSI is 56.21, neutral but weak. No clear direction.
15-minute chart: MACD histogram is 9.25, red histogram is also very short. RSI is 37.80, weak.
Verification result: Indicators for larger timeframes are weak, but the oversold RSI on the 4-hour chart suggests that the downside potential may be limited. Indicators for different timeframes do not form a resonance.
Step 4: Tug of war between bulls and bears (News + On-chain)
1. News:
Positive factors: Trump claims “Bitcoin's position is critical”; Michael Saylor dons his “laser eyes” to be bullish; Goldman Sachs believes “Bitcoin may have bottomed”; news of BTC strongly breaking through $67,000 (although it has since come back down).
Negative factors: Extremely low fear index; Bitcoin OGs continuously cashing out; Coinbase Bitcoin has a negative premium; geopolitical tensions (US-Iran situation).
Core contradiction: Trump’s pronouncement and Goldman Sachs' bottom-finding vs. extreme market fear and capital outflow. There is some divergence between technical indicators and news, with the news having a warm wind but the technical and emotional aspects still being very cold.
2. On-chain data:
The fear and greed index of 9 (extreme fear) is the biggest highlight, usually this is a contrarian indicator. BTC's market dominance is 56%, with no significant outflow from Bitcoin. Total market capitalization slightly increased by 0.58%, but the volume is insufficient. On-chain data (extreme fear) and the technical aspect (4-hour oversold) form a resonance, pointing towards a potential rebound opportunity.
Step 5: The path of least resistance (Trading Strategy)
In summary, the market is at a small-scale bottoming stage within a larger cycle adjustment. Extreme panic and the 4-hour oversold provide a reason for left-side bets on rebounds, but the larger trend has not turned around, and caution is necessary.
Key entry area: Near the valid low point of 66377.03, considering a light position for long bets.
Stop-loss basis: If the price falls below the recent key low of 66281.4, it indicates a failed bottoming, and stop-loss must be enacted.
Target area: First look at the valid high point of 66916.52 above; if it can break through, then look at 67014.91.
Step 6: How to move today (Market Prediction)
1. Current (in a few hours): It's very likely to continue oscillating between 66377 and 66916, with an unclear direction.
2. Key points for today and the near future: The most important support level is 66281.4; if it breaks, it will weaken in the short term. The most important resistance level is 66916.52; if it breaks, there's hope to test above 67000.
3. Trading thought process: The most suitable thought right now is “high sell, low buy within the range,” but I am more inclined to lay down light positions for rebounds near the panic low (close to 66377), as sentiment indicators and some technical indicators show oversold resonance. Strictly implement stop-losses.
4. Summary: The current core contradiction in the market is the confrontation between “extreme panic sentiment” and the “end of large cycle adjustments.”
5. Trading maxim: From the fanaticism of “laser eyes” to the despair of “dead fish eyes,” often there is only a panic candlestick in between; maintaining a plan when others are fearful is the first step from being a retail trader to becoming experienced.
[Qinglan's personal opinion]
Oh dear, this market has me a bit tangled too. In terms of data, with the fear index being so low, and the 4-hour also oversold, based on experience it shouldn't be too pessimistic here, and a rebound could come at any time. But since the daily chart has not yet performed well, my insight is: here you can use a small position to bet on the odds of this panic rebound, but do not get too carried away, the stop-loss must be well set; just treat it as picking up the mispriced chips of market sentiment. Remember, we are not trying to catch the bottom, but rather to trial and error—if right, we profit; if wrong, we run away fast.
This TPV system has been fine-tuned through my years of observation, reviewing, and practical experience; I can't say it’s 100% accurate, but at least it gives us more confidence at key positions. If you want to receive the latest entry opportunities captured according to the TPV system promptly, welcome to the Qinglan Crypto Classroom official website www.qinglan.org, see you in class~
免责声明:本文章仅代表作者个人观点,不代表本平台的立场和观点。本文章仅供信息分享,不构成对任何人的任何投资建议。用户与作者之间的任何争议,与本平台无关。如网页中刊载的文章或图片涉及侵权,请提供相关的权利证明和身份证明发送邮件到support@aicoin.com,本平台相关工作人员将会进行核查。