Hello everyone, I am Qinglan, welcome to the Qinglan Crypto Classroom! Today, we are going to use my unique TPV three-point verification trading system to analyze the current market conditions in detail, all practical and helpful content!
Step 1: First look at the big direction (multi-period trend overview)
Let's list the trend data for four periods:
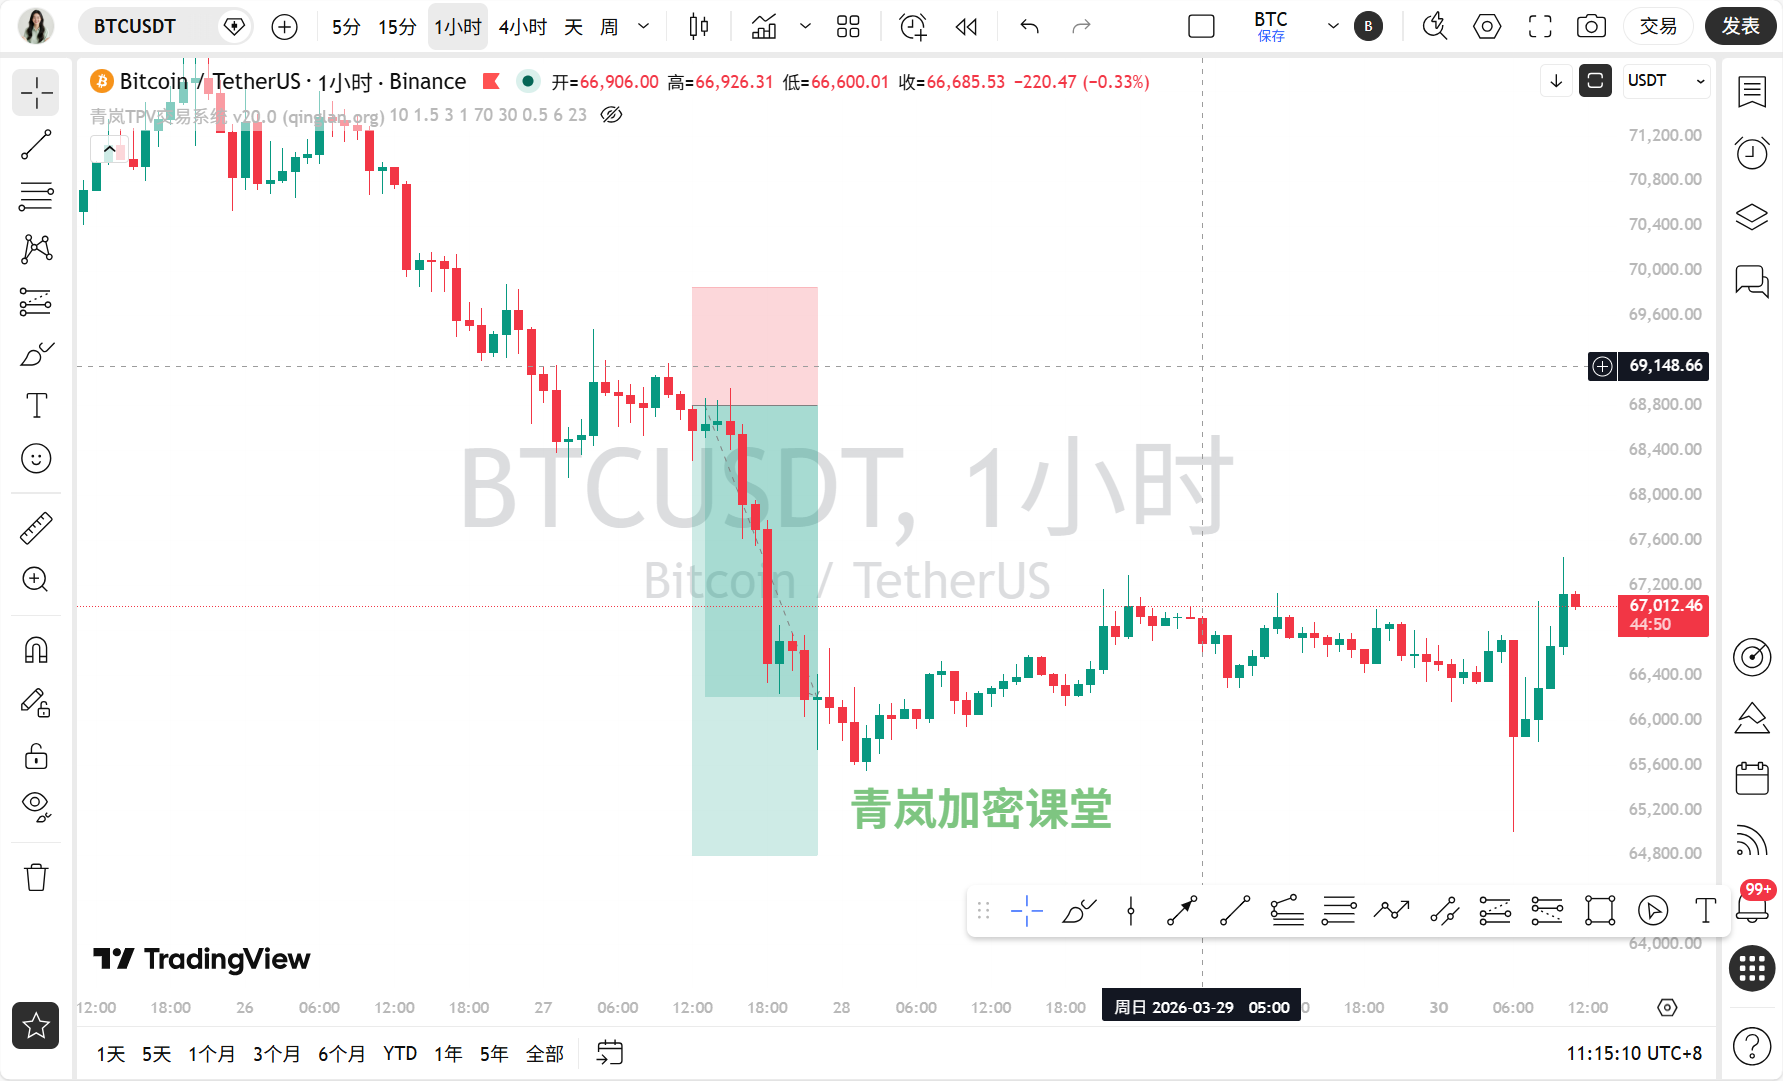
Daily chart: The trend is in a bearish arrangement, as MA5 is 66921.51, MA10 is 68418.44, MA30 is 69552.90, and the price is below the moving averages. The current latest closing price is 66992.0, which is below MA10 and MA30. The on-chain sentiment is "extreme fear", and the index is only 8, which matches the weakness of the larger cycle.
4-hour chart: The trend is also in a bearish arrangement, MA5 is 66538.17, MA10 is 66658.23, MA30 is 68021.86. The current latest closing price is 66992.0, having just surpassed MA5 and MA10, but still far below MA30. The news mentions "Middle East conflict" and "extreme fear", which may have intensified the volatility at the 4-hour level.
1-hour chart: The trend is interweaving of moving averages, MA5 is 66611.59, MA10 is 66501.83, MA30 is 66598.67, and the price is hovering near the moving averages. The latest closing price is 66992.0, slightly above these moving averages. The sentiment is panicked, but the hourly chart is attempting to rebound.
15-minute chart: The trend is in a bullish arrangement, MA5 is 66949.60, MA10 is 66735.34, MA30 is 66459.50. The latest closing price is 66991.99, above the moving averages. This is the smallest period, showing short-term rebound momentum, but the overall environment is fearful.
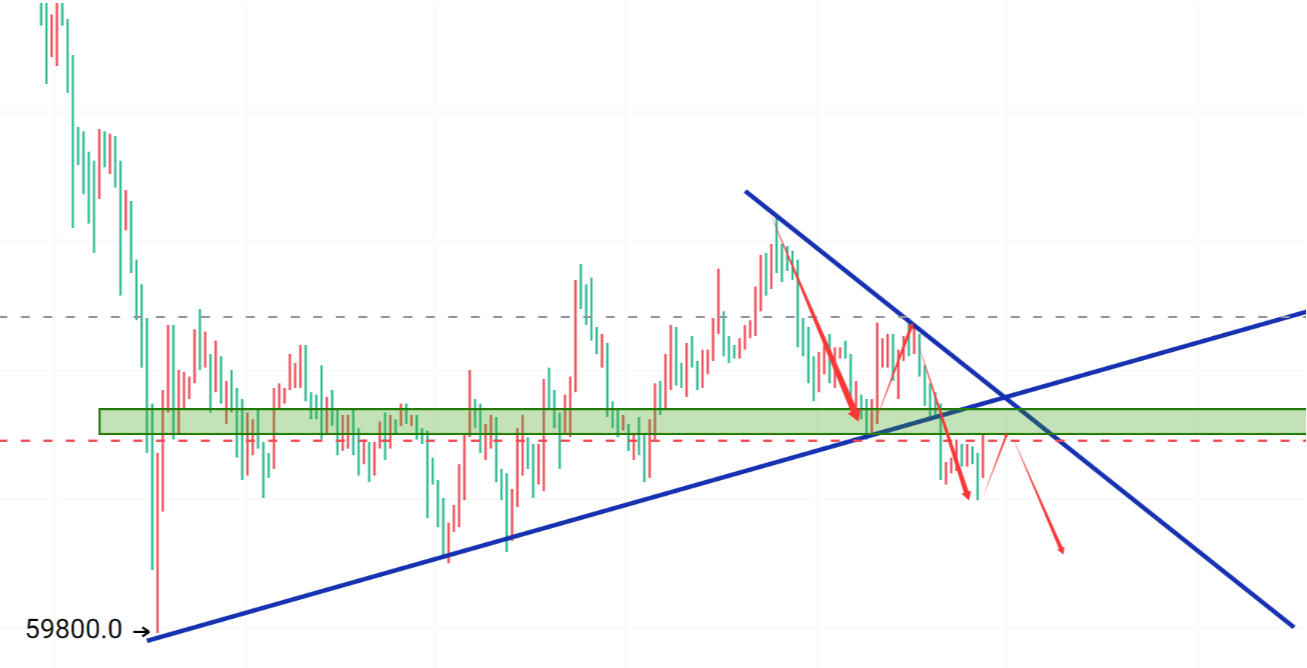
Step 2: Find support points, draw key lines (valid highs and lows + trend lines)
Let’s identify the key support points for each period:
Daily chart: The valid high point is at 67450.0 (from the 1-hour highest price series), and the valid low point is at 65000.0 (from the 4-hour lowest price series). The high point has been confirmed, and the low point has been tested.
4-hour: The valid high point is at 67450.0 (also from the 1-hour highest price series), and the valid low point is at 65000.0 (from the 4-hour lowest price series). A descending trend line can be drawn connecting the high points, and the current price is trying to approach it.
1-hour: The valid high point is at 67145.75 (the latest closing price series of the 1-hour), and the valid low point is at 65800.59 (from the 1-hour lowest price series). This has formed a fluctuation zone.
15-minute: The valid high point is at 67145.75 (same as 1-hour), and the valid low point is at 65638.44 (from the 15-minute lowest price series). The support points are somewhat fragmented, but the recent low point of 65800.59 is very important.
The news "Houthis involved in Middle East conflict" and "Bitcoin drops below $65,000" may have contributed to the panic selling near the low point of 65000.0.
Step 3: Indicators assistance (technical indicators verification)
Indicator status for each period:
Daily chart: The MACD bar is -507.13, DIF is -792.97, DEA is -285.84, in a dead cross state, momentum is downward. RSI is 28.86, in the oversold zone. This verifies the bearish trend on the daily line.
4-hour: The MACD bar is 103.17, DIF is -709.30, DEA is -812.48, although the bar has turned red, both DIF and DEA are still far below zero, indicating a rebound in a downtrend. RSI is 59.26, neutral and slightly strong. The indicators and the price rebound show slight divergence (price rebounds but the main MACD value remains deep in negative territory).
1-hour: The MACD bar is 65.10, DIF is 6.26, DEA is -58.84, in a golden cross state, momentum is upward. RSI is 57.01, neutral. This supports the rebound on the hourly line.
15-minute: The MACD bar is 92.00, DIF is 163.02, DEA is 71.02, in a golden cross state, momentum is strong. RSI is 70.41, approaching overbought. The indicators for small periods are very strong, but caution is needed for overheating.
No obvious top divergence or bottom divergence is currently seen.
Step 4: Bull and bear arm wrestling (news + on-chain)
News:
Positive factors: "Bitcoin ETF capital situation is warming", "Bitcoin rebounding strongly, price exceeds $67,000", "El Salvador's Bitcoin reserves reach 7605."
Negative factors: "Middle East conflict + extreme fear, will BTC break 65,000?", "Crypto fear index drops to 8, market fear sentiment intensifies", "Bitcoin drops below $65,000, CEX and DEX funding rates show a comprehensive bearish market", "Willy Woo: Traditional on-chain models predict Bitcoin's bottom range is $46,000 to $54,000."
The most important core factor is the panic triggered by the "Middle East conflict" and the battle over the "ETF capital situation warming," which is expected to continue to ferment. Currently, the technical side (small period rebound) and the news side (extreme fear) are diverging, so caution is needed.On-chain data:
The fear and greed index is 8, classified as "extreme fear," with extremely poor market sentiment. BTC's dominance is 56.04%, with no changes reported. The total market value is 2391089535650.4194, with a 24-hour change of 0.26%, slightly up. The on-chain data (extreme fear) resonates with the technical side (daily bearish) but diverges with the small period (15-minute bullish). The capital flow shows overall caution still.
Step 5: The path of least resistance (trading strategy)
In summary, the large periodic bearish pressure, small periodic rebound is weak, and market sentiment is in extreme fear. The path of least resistance may still be to test support downward. However, in the short term, due to being oversold, a rebound may happen.
Key entry area (short): Consider entering when a rebound reaches near 67145.75 (recent 1-hour high) and is under pressure.
Stop loss basis: If it effectively breaks above 67450.0 (higher high), then stop loss.
Target area: First target 65800.59 (recent 1-hour low), second target 65000.0 (critical 4-hour low).
Today's trading thought: Prioritize shorting on rebounds, strictly manage stop losses, and do not chase the rise.
Step 6: How to proceed today (market prediction)
Current (within a few hours): Expected to fluctuate between 66500.0 to 67200.0, slightly biased towards a rebound, but with significant pressure above.
Today and recent key: The most important support level is 65000.0, and the most important resistance level is 67450.0. Attention is needed on the descending trend line pressure drawn from 67450.0.
Trading thought: The currently most suitable and only trading direction is "short after the rebound faces resistance", because the larger period is in a bearish arrangement, sentiment is fearful, and a rebound may provide better shorting opportunities.
Summary: The core contradiction in the current market is the confrontation between extreme panic sentiment and technical rebounds in small periods.
Trading quote: War ignites panic, ETF quietly recovers, the market always seeks direction between despair and greed.
[Qinglan TPV Trading System Backtest Data]
Based on nearly 438 historical backtests, the accuracy rate is 70.8% (last backtest time 03-29 09:15:39). The backtest results are for reference only for strategy confidence, and past performance does not guarantee future returns.
[Qinglan's Personal Views]
Oh, seeing this fear index at only 8 really makes one sweat. The market sentiment at its coldest often means a turning point may be brewing, but we cannot guess the bottom. My insight is that under such extreme sentiment, rebounds in small periods look very tempting, but we must pay attention to the larger cycle. As long as the daily bearish arrangement has not changed, all rises should be viewed as a rebound first. We must be like a hunter, patiently waiting for the rebound to reach the key pressure level before striking so that the risk-reward ratio is worthwhile. Remember, protecting the original capital is always the first priority!
This TPV system has been gradually developed through my years of market watching, reviewing, and practical experience. I cannot say it is 100% accurate, but it can at least give us more confidence at key positions. If you want to receive the latest entry opportunities captured based on the TPV system as soon as they come out, welcome to visit the Qinglan Crypto Classroom official website www.qinglan.org, see you in class!
免责声明:本文章仅代表作者个人观点,不代表本平台的立场和观点。本文章仅供信息分享,不构成对任何人的任何投资建议。用户与作者之间的任何争议,与本平台无关。如网页中刊载的文章或图片涉及侵权,请提供相关的权利证明和身份证明发送邮件到support@aicoin.com,本平台相关工作人员将会进行核查。