Follow to receive the TV Long and Short Oscillation Indicator for free, helping you to see through the uncertainty ahead, no need to draw lines for support and resistance
Operational Direction Strategy Suggestions (Kind reminder: Market conditions change rapidly, operations should be combined with real-time market dynamics, please feel free to contact for exchanges)
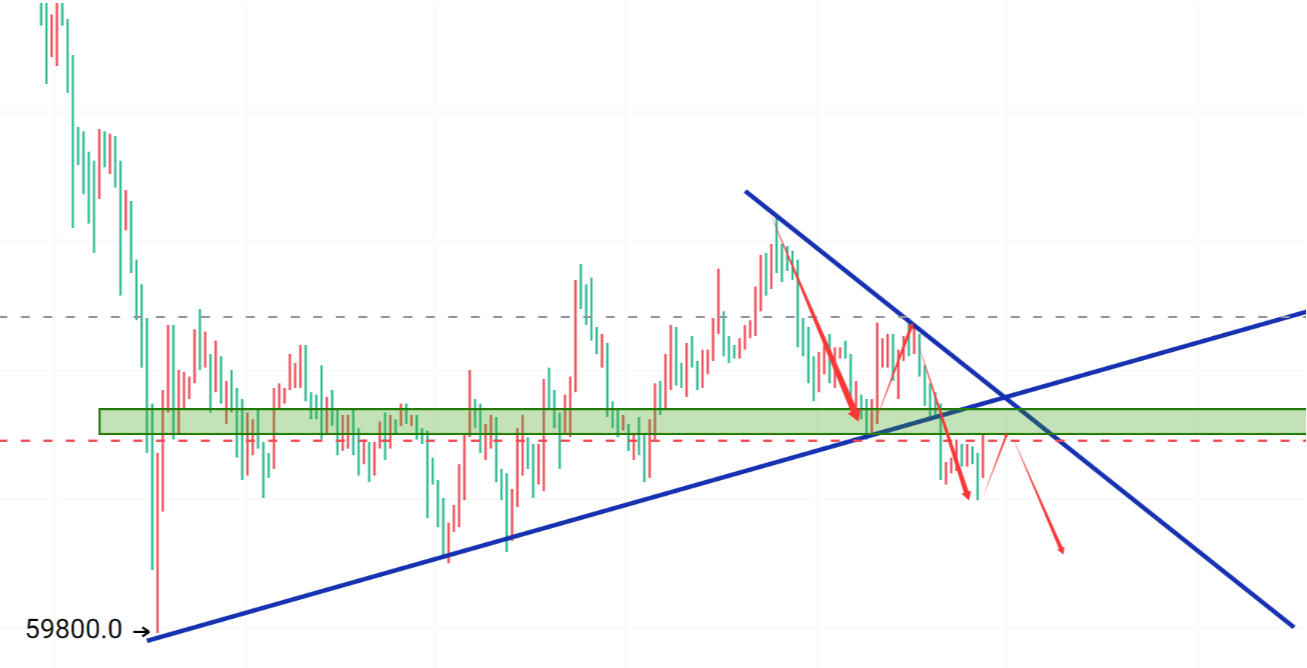
Partial entry: Left side entry (aggressive): If the price retraces to stabilize between 65800 - 66200, establish a long position with a light position, using 65000 as the final defense.
Right side entry (conservative): Wait for a 1-hour closing price to stabilize above 67500, accompanied by an increase in trading volume, regarded as a short-term breakout, can then enter in line with the trend.
Target position: First target 68800, second target 71200
Stop-loss suggestion: If it falls below 64800, strict stop-loss is necessary to prevent a second bottom after the TD bottom signal fails.
Position management: Considering the volatility at the Monday open, total position not to exceed 10%
Key levels:
Resistance level: 68800 - 69600 (around MA120)
Support level: 65000 (previous TD13 bottom) and 64200
I. News Overview
Interest rate hike expectations drop sharply (bullish): Market data shows that the probability of a 25 basis point interest rate hike by the Federal Reserve in April has dropped to 4.1%. This shift in macro expectations alleviates liquidity pressure on risky assets, temporarily weighing on the dollar index and providing upward momentum for BTC.
Institutional Game and ETF Dynamics (neutral): Although interest rate hike expectations have slowed, the scale of capital inflow into spot ETFs at the beginning of the week remains a focal point for the market. If the U.S. stock market opens on Monday with a positive net inflow, it will confirm the sustainability of the current rebound.
On-chain Data (bullish): Monitoring shows that a large number of short-term holdings around the 65000 support level have turned into long-term holdings, suggesting that a consolidation phase may be nearing its end.
Summary: Overall, the news is neutral to slightly bullish. The market is emerging from the hawkish shadow of the Federal Reserve, and sentiment is in the early stages of recovery.
II. Technical Analysis
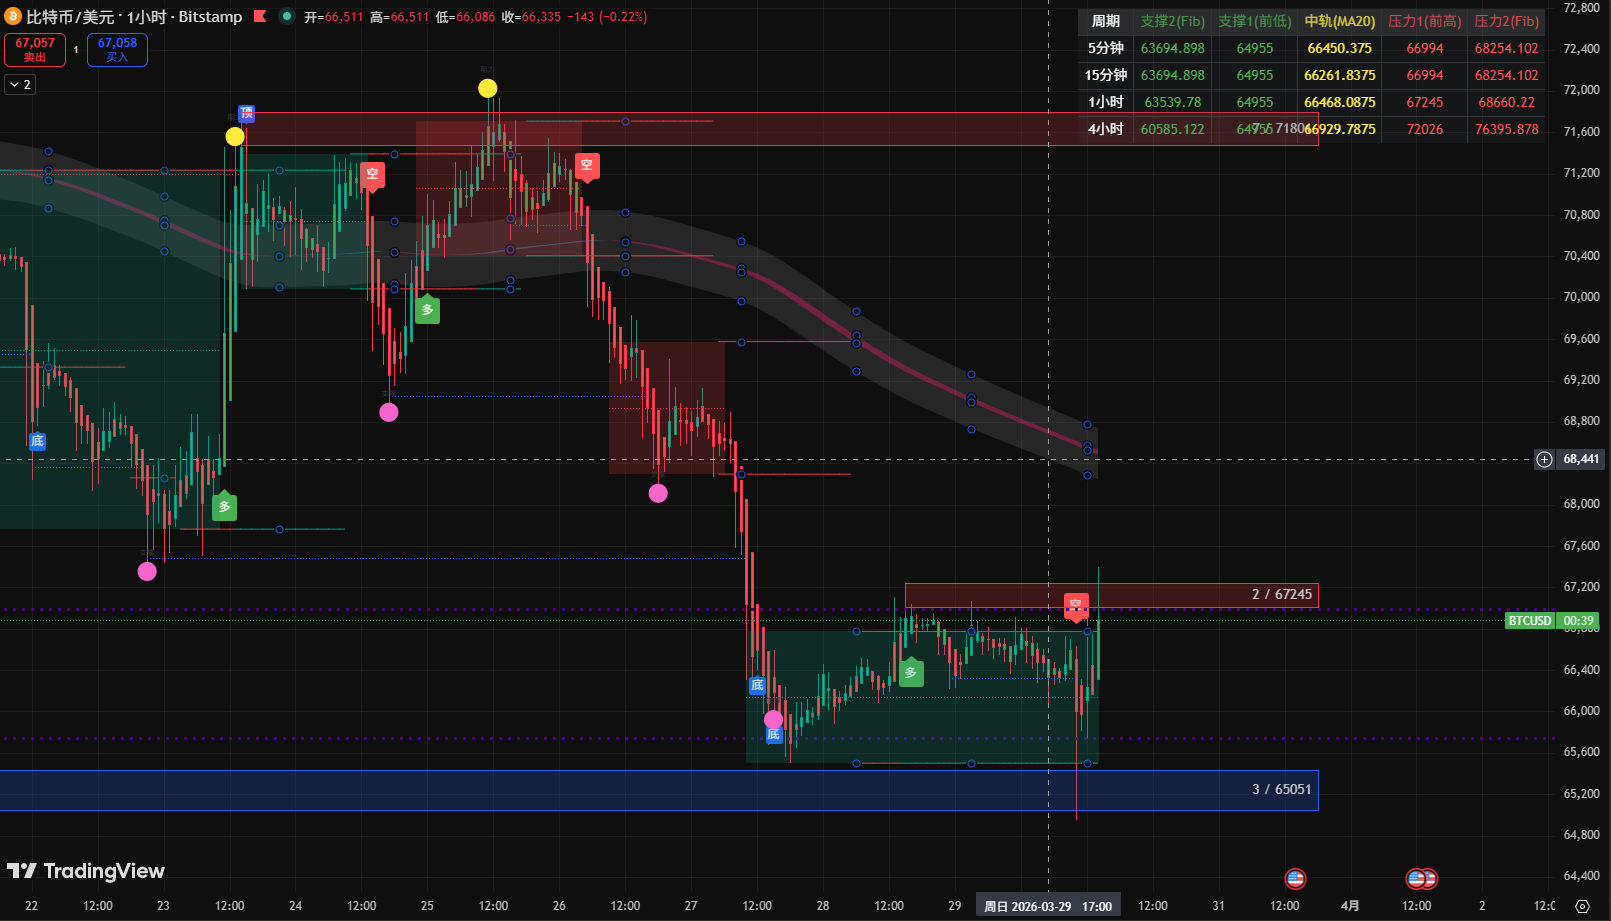
Current price: Approximately 66770
Moving average (MA): From the 1-hour chart, the price is oscillating below MA24 (67728).
Key characteristics: The moving averages are currently showing a converging and flattening state, and the price is fluctuating within a very narrow range. MA120 (69670) still creates strong pressure above; if this line cannot be reclaimed, the medium-term is still suppressed within a downward channel.
TD indicator: A clear TD13 bottom signal was formed around 65000 previously, followed by a halt in the decline and a rebound.
RSI: Positioned in a neutral zone, neither overbought nor oversold, indicating that a turning point is about to arrive.
Bollinger Bands: The 4-hour Bollinger Bands are starting to tighten, indicating that volatility is being compressed, and a breakout with volume is expected within the next 24 hours.

免责声明:本文章仅代表作者个人观点,不代表本平台的立场和观点。本文章仅供信息分享,不构成对任何人的任何投资建议。用户与作者之间的任何争议,与本平台无关。如网页中刊载的文章或图片涉及侵权,请提供相关的权利证明和身份证明发送邮件到support@aicoin.com,本平台相关工作人员将会进行核查。