Last week the market trend overall met expectations—Bitcoin maintained a weak fluctuation near the lower boundary of the ascending channel, with a bearish trend dominating the pattern unchanged; HYPE confirmed the support area of 36~38 dollars, continuing its independent upward logic.
This week's report will further dissect the current trend structure, update market predictions and operational plans, and comprehensively review last week's trading execution.
This week's core trading viewpoints summary:
• HYPE's market prediction and short-term operational strategy for this week. (Detailed explanation in the first section)
• In-depth deconstruction of HYPE's current trend structure (hourly level). (Detailed explanation in the second section)
• BTC's market prediction and medium to short-term operational strategy for this week. (Detailed explanation in the third section)
• BTC operational review. (Detailed explanation in the fourth section)
Last week's core viewpoints market validation:
• HYPE short-term trading effectiveness: HYPE completed one short-term long position operation (1x leverage) last week, achieving a profit of approximately 5.25%. (Detailed explanation in Table 1)
• BTC short-term trading effectiveness: Bitcoin completed one short-term short position operation (1x leverage) last week, achieving a profit of approximately 6.17%. (Detailed explanation in Table 2)
• BTC medium-term trading effectiveness validation: Bitcoin followed the established medium-term strategy last week, continuing to hold a short position established at 89,000 dollars (1x leverage), closing last week at approximately 66,962 dollars for a profit of about 24.76%, with a maximum profit of around 32.58% during the period.
• BTC market trend prediction validation: In last week's article, we clearly pointed out that the market would maintain a fluctuating adjustment pattern, with both bulls and bears contesting near the lower boundary of the channel (formed from the low point on February 6). The current market trend has validated our previous predictions.

1. HYPE: Market prediction and short-term operational strategy
1. HYPE's market trend prediction for this week: We believe the current market structure still maintains a daily level upward trend. The price is in the pullback confirmation phase after breaking through the peak of Wave I (the February 3 high of 38.41 dollars). This week, pay close attention to the effectiveness of the support in the 36~38 dollars area. If the pullback confirmation is effective, the market will continue to operate on an upward trend.
2. HYPE short-term operational strategy for this week:
• Based on the prediction of the upward structure, the principle of "follow the trend, buy on dips" should be followed.
• Use 30-minute/60-minute as the operational cycle, strictly adhere to stop-loss discipline; utilize 30% positions, based on support and resistance levels, to seek "arbitrage" opportunities.
3. HYPE upward risk warning: Although HYPE's trend is independent, it cannot completely detach from Bitcoin's broader environment. If Bitcoin's trend sees a significant adjustment afterward, it may affect HYPE's rebound momentum.
2. HYPE: Short-term operational review and trend structure deconstruction
1. HYPE short-term operational review (1x leverage): (03.23~03.29)
We strictly followed the operational plan and combined the trading signals from our self-constructed arbitrage trading model and momentum quantitative model to execute a short-term (long position) operation on HYPE last week, successfully profiting by 5.25%.
• HYPE short-term trading detailed summary: (Leverage * 1x)
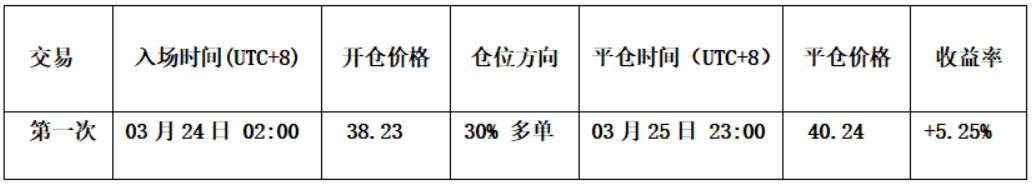
Table 1
• Opening decision: This opening decision (see Figure 1) was based on satisfying three upward conditions. First, we predicted that the previous hourly adjustment near endpoint 34 was likely to end; second, the arbitrage quantitative model triggered a strong bottom signal (red dot + white dot); third, the momentum quantitative model emitted a bottom divergence signal. Accordingly, we executed a long position opening at 38.23 dollars with a 30% position.
• Closing decision: Based on the arbitrage quantitative model triggering a top bearish signal (white dot); the momentum model emitted a top divergence signal; and the K-line combination emitted a "strong top differentiation" signal. These three signals formed a technical resonance, so we executed a closing operation near 40.24 dollars.
• Trading summary: This operation successfully profited approximately 5.25%.
HYPE_60-minute K-line chart (momentum quantitative model + arbitrage trading model):
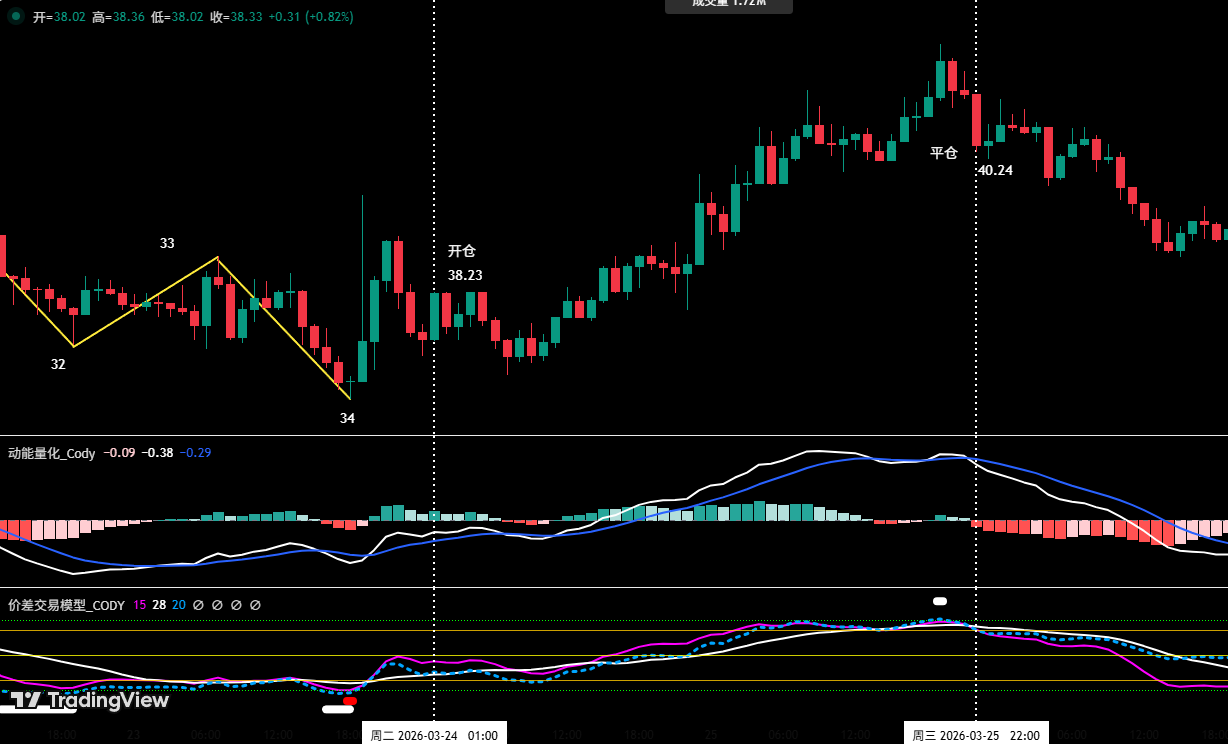
Figure 1 (short-term trading illustration)
2. In-depth analysis of HYPE's current trend structure (using 1-hour for analysis)
• As shown in (Figure 2), reviewing HYPE's hourly level trend during the period from the 16th to the 22nd, the price successfully constructed a downward center (Center C). We initially predicted that the market might form a low point near endpoint 32 (around 37.52 dollars), but the actual trend showed that the low point appeared at a lower endpoint near 34 (around 36.79 dollars), dipping about 0.73 dollars from the predicted position.
• HYPE's hourly level internal structure division last week: (03.23~03.29)
a. As shown in (Figure 2), starting from endpoint 34, HYPE's trend evolved into a complex oscillation structure composed of 8 segments from 34-35, 35-36, 36-37, 37-38, 38-39, 39-40, 40-41, to 41-42. As of the analysis time, segment 41-42 is in operation.
b. The 34-35 segment forms an upward structure.
c. The segments 35-36, 36-37, 37-38, 38-39, 39-40, 40-41, 41-42 together form an adjustment structure. Among them, the segments 36-37, 37-38, 38-39, 39-40, 40-41 overlap with each other, jointly constructing a downward center (i.e., Center D).
d. The current market is running in an outgoing segment (41-42 segment). As shown in (Figure 2), the outgoing segment has formed a momentum divergence signal compared to the entering segment (35-36 segment). If the divergence signal still exists after the outgoing segment ends, the probability of price moving upward is high.
HYPE_1-hour K-line chart:
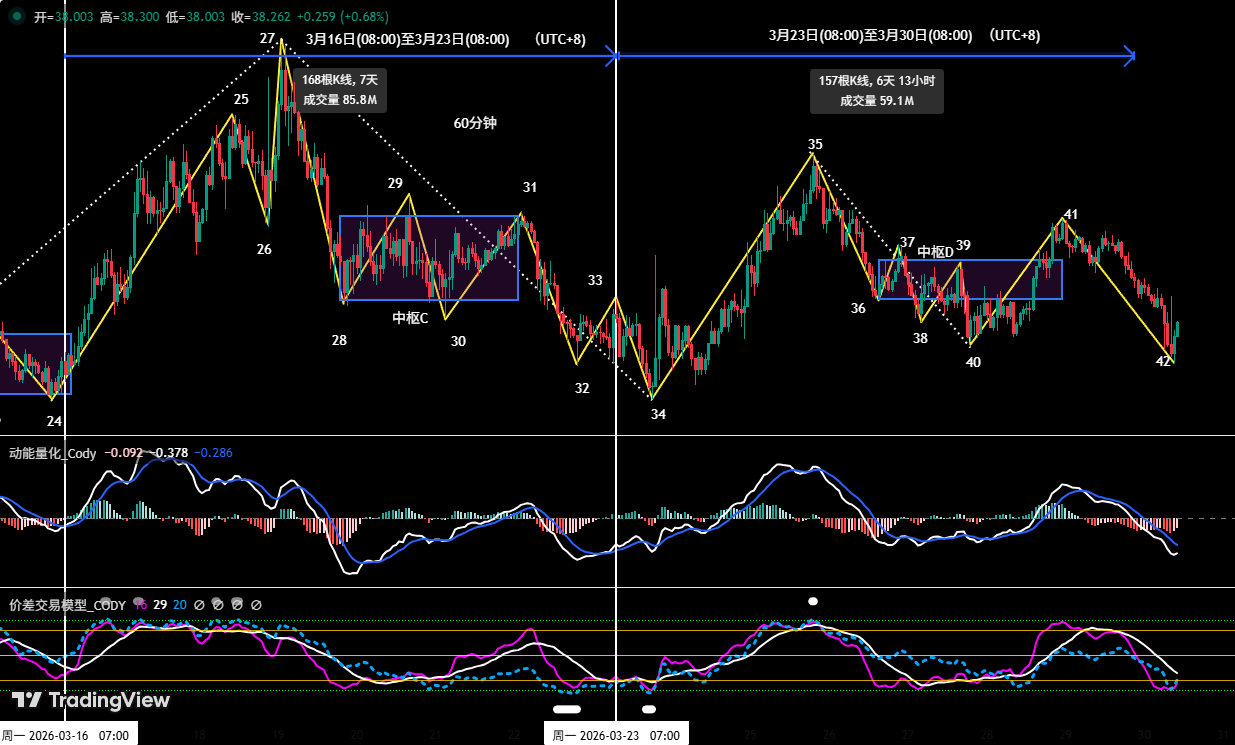
Figure 2
3. Bitcoin: Market prediction and operational strategy for this week
1. In-depth analysis of Bitcoin's current trend structure (using 4-hour for analysis)
• Based on the market since the low point on February 6 (around 60,000 dollars).
• Maintain the previous core judgment framework: In the February 16 Weekly Review, we clearly stated that the upward trend starting from the low point on February 6 belongs to a major level C wave adjustment internal C-2 wave overshooting rebound, followed by C-3 wave adjustment.
• Conditions for the C-3 wave to form: If Bitcoin's price falls below the low point on February 6 (around 60,000 dollars), then the C-3 adjustment wave will be established.
• Current interpretation of the BTC layout: As shown in (Figure 3), in the 4-hour analysis period, Bitcoin effectively broke through the short-term upward trend line formed since the low on February 24 last week and has dropped near the lower boundary of the upward channel formed since the rebound from the low on February 6, currently undergoing narrow fluctuations around this position. If this position fails, the market may retest the 60,000 dollar level downward.
• BTC hourly level trend structure in-depth analysis: As shown in (Figure 3), in the 4-hour analysis period, Bitcoin has retraced from the high point of about 76,000 dollars on March 17, evolving into an adjustment structure of 5 segments of 13-14, 14-15, 15-16, 16-17, 17-18. Among them, the segments 14-15, 15-16, and 16-17 form a downward center (Center B), and the subsequent outgoing segment (17-18 segment) has fallen to the vicinity of the upper boundary of the channel. Currently, only the arbitrage trading model triggers a bottom warning signal (white dot) at this position. Thus, the coin price presents a weak fluctuation pattern at this position to correct the oversold status of the 4-hour technical indicators.
Bitcoin _4-hour K-line chart:
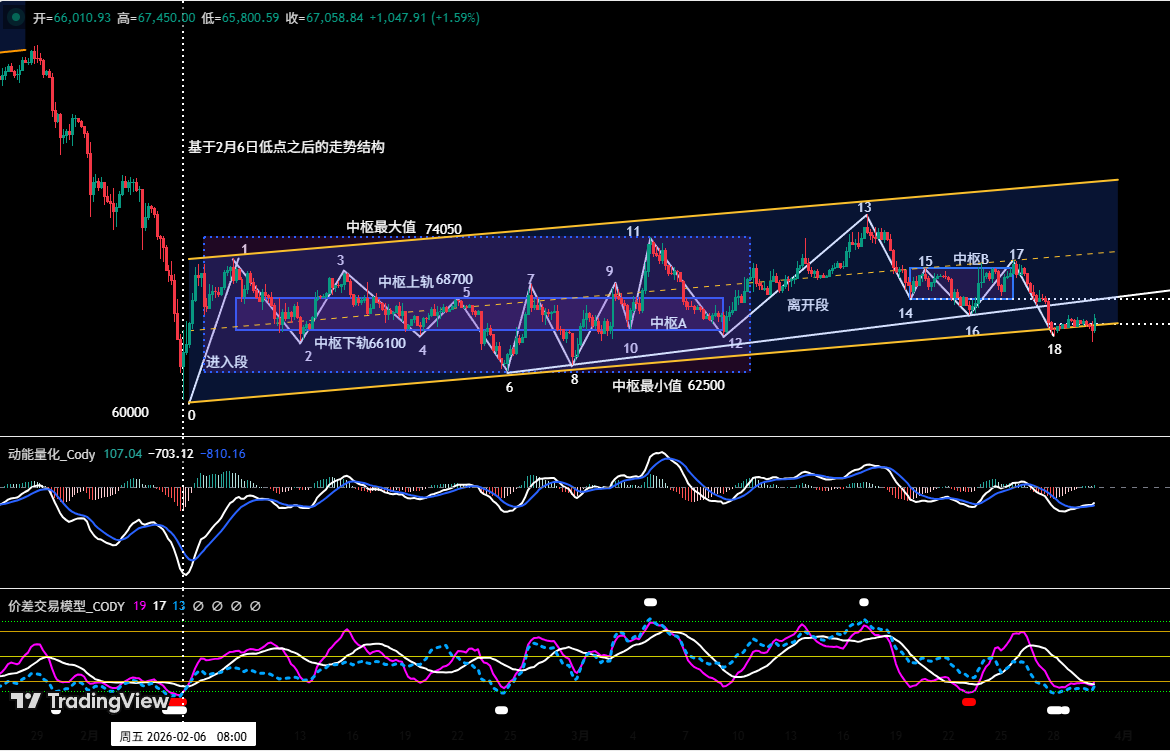
Figure 3
2. This week's core viewpoint: Maintain a fluctuating adjustment pattern, observe the contest between bulls and bears near the lower boundary of the channel (since the low on February 6).
3. Core resistance levels:
• First resistance zone: 69,500~72,000 dollars area (previous fluctuation interval)
• Second resistance zone: 74,500~76,000 dollars area (near the low on November 2025)
4. Core support levels:
• First support level: 65,000~66,000 dollars area (previously important support area)
• Second support level: 60,000~62,500 dollars area (near the low on February 6)
• Third support level: near 57,400 dollars
5. This week's operational strategy (excluding the impact of unexpected news): (03.30~04.05)
① Medium-term strategy:
Bitcoin _Daily K-line chart: (position monitoring model)
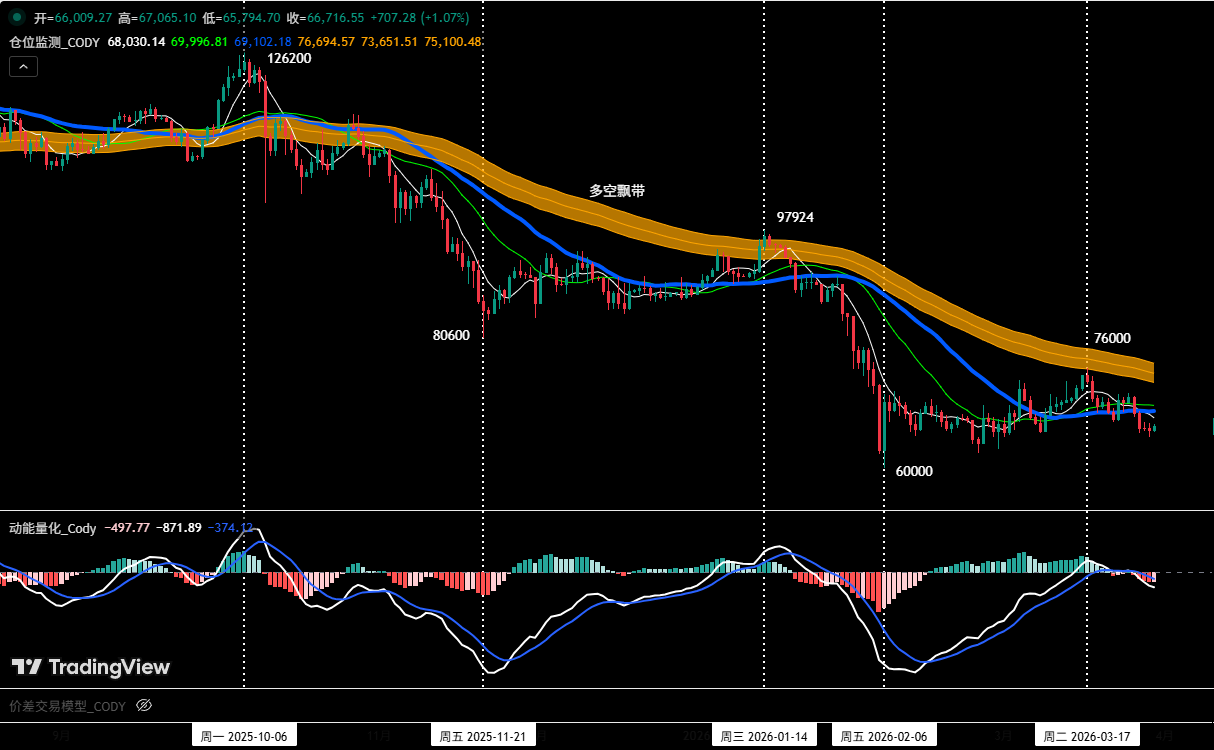
Figure 4
Position monitoring model: As shown in (Figure 4), the current coin price is located below the bullish-bearish floating band (yellow), with the bearish trend continuing. Based on strategy rules, we continue to hold the 60% short position established at 89,000 dollars (on January 28). If the coin price effectively rebounds and breaks above the bullish-bearish floating band and stabilizes above, the medium-term position will be fully cleared.
② Short-term strategy: Utilize a 30% position, set stop-loss points, and based on support and resistance levels, seek "arbitrage" opportunities. (Using 30-minute/60-minute as the operational cycle).
③ Based on the prediction of the medium-term bearish trend, currently adhere to the operational principle of "trending short." To dynamically respond to the complex market evolution and combine signals from our self-constructed trading models, we will formulate two short-term operational plans A/B:
•Plan A: Rebound encounter resistance, short on rallies.
• Opening position: When the coin price rebounds to the 69,500~72,000 dollars area triggering resistance signals combined with the model top signal, a 30% short position may be established.
• Risk control: The initial stop-loss for the short position is set above 74,500 dollars.
• Closing position: When the coin price falls near important support levels combined with model signals, positions may be gradually cleared for profit-taking.
•Plan B: Trend-following breakdown short position.
• Opening position: When the coin price effectively falls below the 65,000~66,000 dollars area, and combined with model top signals, a 30% short position can be established in accordance with the trend.
• Risk control: The initial stop-loss for the short position is set above 67,500 dollars.
• Closing position: When declining to support levels combined with model signals, positions may be gradually cleared for profit-taking.
4. Bitcoin: Operational review
1. Short-term operation review: (see Table 2)
We strictly followed the operational plan, using trading signals from the self-constructed arbitrage trading model and momentum quantitative model to complete a short-term (short position) operation last week, profiting 6.17%.
① Bitcoin short-term trading detailed summary: (Leverage * 1x)
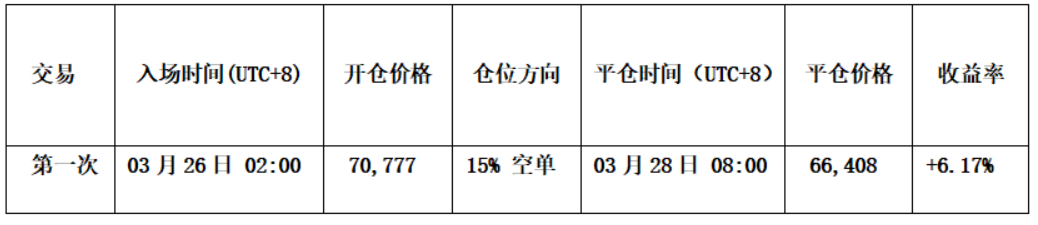
Table 2
② Short-term trading review: (see Figure 5)
• Opening position: When the coin price rebounds encountering resistance near 72,000 dollars, the arbitrage trading model simultaneously triggers a top warning signal (white dot), and resonates with the momentum quantitative model to go short. Based on this overlapping signal, we established a 15% short position at 70,777 dollars.
• Closing position: When the coin price stabilizes near 65,000 dollars, and the arbitrage trading model triggers a strong bottom warning signal (red dot + white dot), we cleared all positions near 66,408 dollars.
• Summary: This trade successfully profited approximately 6.17%.
Bitcoin _60-minute K-line chart: (momentum quantitative model + arbitrage trading model)
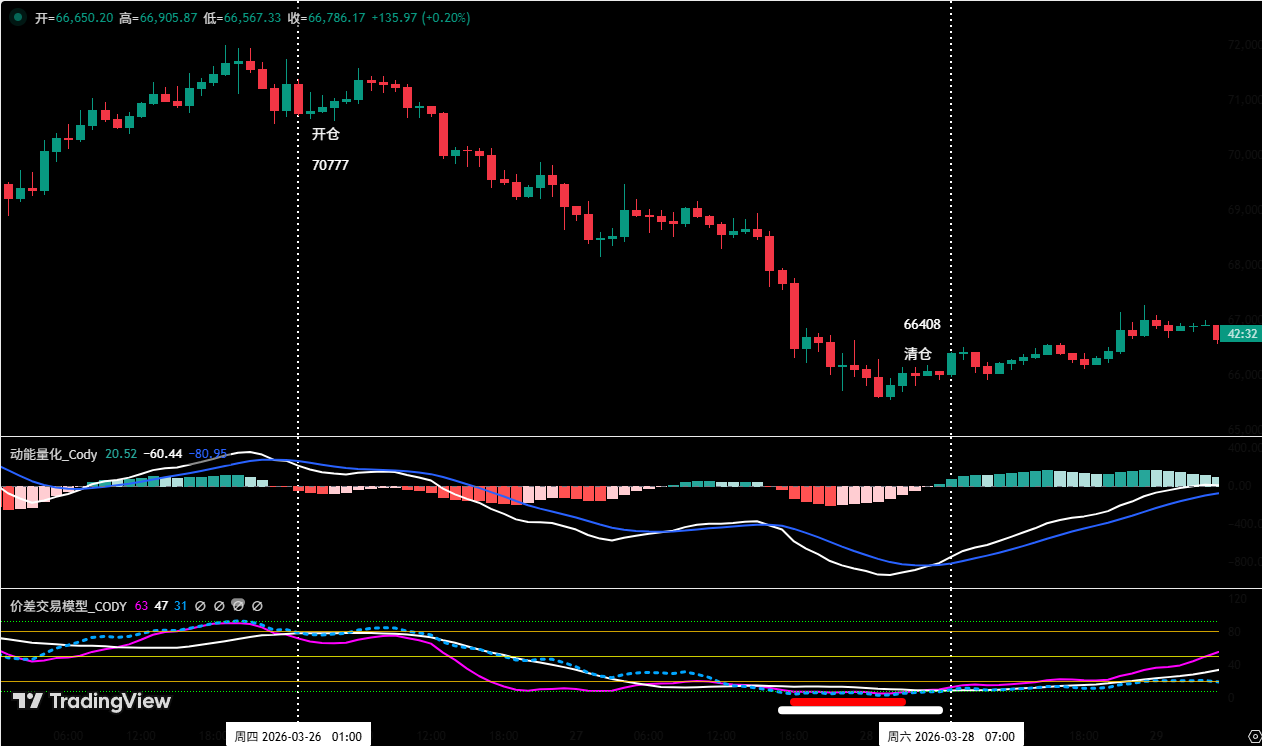
Figure 5 (short-term trading illustration)
2. Medium-term operation review:
Medium-term strategy: Continue to hold a 60% short position established at approximately 89,000 dollars (on January 28), achieving a profit of about 24.76% as of last week's post-market (closing price approximately 66,962 dollars).
5. Special reminders:
1. When opening a position: immediately set the initial stop-loss.
2. When profit reaches 1%: move the stop-loss to the opening cost price (breakeven point) to ensure capital safety.
3. When profit reaches 2%: move the stop-loss to the position of 1% profit.
4. Continuous tracking: thereafter, every additional 1% of profit, the stop-loss point moves 1% synchronously, dynamically protecting and locking in profits.
Financial markets change rapidly, and all market analysis and trading strategies must be dynamically adjusted. All viewpoints, analytical models, and operational strategies mentioned in this article are based on personal technical analysis for personal trading logs and do not constitute any investment advice or operational basis. The market has risks, and investments require caution; please do not make decisions based on this.
免责声明:本文章仅代表作者个人观点,不代表本平台的立场和观点。本文章仅供信息分享,不构成对任何人的任何投资建议。用户与作者之间的任何争议,与本平台无关。如网页中刊载的文章或图片涉及侵权,请提供相关的权利证明和身份证明发送邮件到support@aicoin.com,本平台相关工作人员将会进行核查。


